
Page 200 - How to Make Money in Stocks Trilogy
P. 200
96 A WINNING SYSTEM
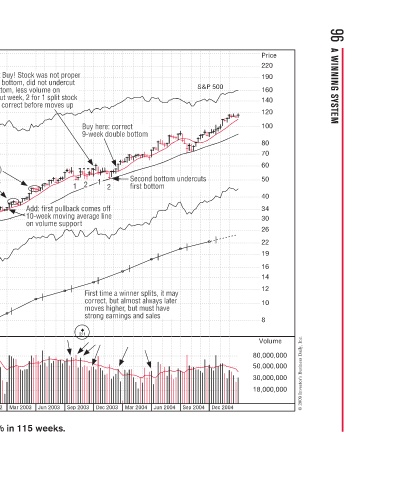
Price 220 190 160 140 120 100 80 70 60 50 40 34 30 26 22 19 16 14 12 10 8 Volume 80,000,000 50,000,000 30,000,000 18,000,000 © 2009 Investor’s Business Daily, Inc.
S&P 500 rcuts u Dec 2004
d bottom undercuts Second bottom undercuts d m t d b m t ay m t r r e a Sep 2004 Jun 2004
correct t r 9-week double bottom m o e Second d o S S S first bottom First time a winner splits, it t ma s e w correct, but almost always late correct, but almost always late w a o a u moves higher, but must have s m u strong earnings and sales a d a g n Mar 2004
Buy here: correct Buy here: c c re h u e 1 1 1 2 f f o e g g m t g r g o Dec 2003
r r p o r c st v B B B 9 2 2 2 1 1 : first pullback comes off Add: first pullback comes off m o c l p 10-week moving average line e g g v m o u e s r c o s 2/1 Sep 2003
Do Not Buy! Stock was not prope Do Not Buy! Stock was not prope s u double bottom, did not undercut t n t o less volume on 1st bottom, less volume on o m o m 1st bottom breakout week, 2 for 1 split stock p o , should correct before moves up o o % % p ak) Add: fir Add: fi i i d
4 tight weeks: stock still under 4 tight weeks: stock still under u s h accumulation even after up 50% accumulation even after up 50% u e m from 30 to 45, (note 6 prior up r weeks that all closed at the pea h c s 3 tight closes 3 tight closes t g Buy B week double botto 16-
Dec 2001 Mar 2002
Sep 2001
Jun 2001
Mar 2001
eBay–2002 Weekly Chart Dec 2000 Sep 2000
Price = 20*eps 10 9.00 8.00 7.50 7.00 6.50 6.00 5.50 5.00 4.50 4.00 3.50 3.00 2.50 2.25 2.00 1.80 1.60 1.50 1.40 1.30 1.20 1.10 1.00 0.90 0.80 0.75 0.70 0.65 0.60 0.55 0.50 0.45 0.40 0.35