Page 199 - How to Make Money in Stocks Trilogy
P. 199

96
         A WINNING SYSTEM
           Price
                      100
                160
              190
                    120
                  140
            220
                S&P 500
                        9-week double bottom
                        m
                        o
                      t
                      correct
                      Buy here: correct
                        e
                      r
                        u
                      c
                      Buy here: c
                      re
                      h
                        e
                      B
                      B
                      B
                        9
              r
              r
              Do Not Buy! Stock was not prope
              Do Not Buy! Stock was not prope
                  breakout week, 2 for 1 split stock
              p
               double bottom, did not undercut t
                   should correct before moves up
                  c
                  st
               r
                1st bottom, less volume on
                less volume on
                   v
              o
               n
                o
                  p
              s
               t
                m
                   o
                  o
                o
                  ,
                1st bottom
                m
              u
               o
                   o
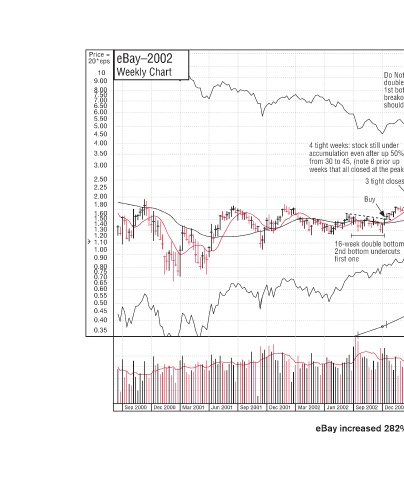
                          4 tight weeks: stock still under  80 4 tight weeks: stock still under  u  s  h  70 accumulation even after up 50% accumulation even after up 50%  %  %  u  e  m from 30 to 45, (note 6 prior up  p  r  60  ak) weeks that all closed at the pea  h  c  s  50 d bottom undercuts  rcuts Second bott
                                                                     Dec 2001 Mar 2002
                                                                     Sep 2001
                                                                     Jun 2001
                                                                     Mar 2001
           eBay–2002  Weekly Chart                                   Dec 2000 Sep 2000
          Price =  20*eps  10   9.00    8.00    7.50   7.00   6.50    6.00    5.50   5.00   4.50    4.00    3.50   3.00    2.50    2.25   2.00    1.80   1.60    1.50    1.40    1.30    1.20    1.10    1.00    0.90    0.80    0.75    0.70    0.65    0.60    0.55    0.50    0.45    0.40    0.35
   194   195   196   197   198   199   200   201   202   203   204