Page 218 - How to Make Money in Stocks Trilogy
P. 218

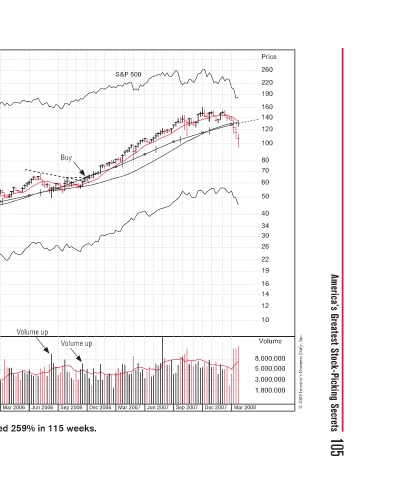
America’s Greatest Stock-Picking Secrets  105


           Price  260  220  190  160  140  120  100  80  70  60  50  40  34  30  26  22  19  16  14  12  10  Volume  8,000,000  5,000,000  3,000,000  1,800,000  © 2009 Investor’s Business Daily, Inc.
                                                                     Mar 2008

                                                                     Dec 2007

                                                                     Sep 2007

                                                                     Jun 2007

              S&P 500                                                Mar 2007

                                                                     Dec 2006
                                                          Volume up  u  m
                            y                                        Sep 2006
                            Buy  u                        o
                                                        Volume up  u  Jun 2006
                                                                     Mar 2006

                                                                     Dec 2005 Precision Castparts increased 259% in 115 weeks.

                                           s

                  Market correction  et  Buy  19-week saucer-with-handle  a many tiny weekly price spreads many tiny weekly price spreads  w  V  Jun 2005 Mar 2005
                  n  o                     c            Volume up  e  2/1  Sep 2005
                                                        Big volume
                                         19-w
                                         19-w
                                         9
                                         9
                                           m
                                                        B g
                                                                     Dec 2004 Sep 2004
           Precision Castparts–2005  Weekly Chart                    Jun 2004 Mar 2004 Dec 2003


          Price =  20*eps  13  12  11  10   9.00    8.00    7.50    7.00   6.50      6.00    5.50    5.00    4.50    4.00    3.50    3.00    2.50    2.25    2.00     1.80    1.60    1.50    1.40    1.30    1.20    1.10    1.00    0.90    0.80    0.75    0.70    0.65    0.60    0.55    0.50    0.45
   213   214   215   216   217   218   219   220   221   222   223