Page 214 - How to Make Money in Stocks Trilogy
P. 214

America’s Greatest Stock-Picking Secrets  103


             Price  36  27  23  19  16  13  11  9  7  6  4.6  3.6  2.7  2.3  2.0  1.6  1.4  1.1  0.9  Volume  16,000,000  8,000,000  4,000,000  2,000,000  © 2009 Investor’s Business Daily, Inc.

                                                                     Sep 2006
                                                         4/1
                                                                     Jun 2006
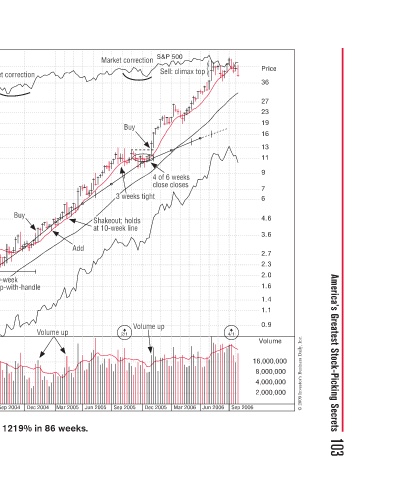
             Sell: climax top  a  i  s  e  s                         Mar 2006
             o
           S&P 500  n  n  :    4 of 6 weeks   o  close closes  c  o  gh  Volume up Volume up  olume up  p  u  m  Dec 2005

           Market correction  t  r  r  M  Buy  u  3 weeks tight weeks tight  s t  e  3ee  3 w  3  3  out; holds Shakeout; holds  s  s  o  o  at 10-week line  n  k  w  2/1  Sep 2005


                                      Shakeo
                                      a
                                       1
                                      S
                                      S
                                      S
                                      S
                                       a
                                           Add  A                    Mar 2005
                                           d                         Jun 2005
                                                         olume up  p Volume up  e
                                                 e  e                Dec 2004
              n  t                   y  y        handl
              Market correction  k   Buy        20-week  -we  2  cup-with-handl  with  up  cu  cu  c  c  c  Sep 2004
                                                                     Jun 2004 Hansen Natural increased 1219% in 86 weeks.
                                                                     Mar 2004

                                                                     Dec 2003

                                                                     Sep 2003

                                                                     Jun 2003

                                                                     Mar 2003 Dec 2002
           Hansen Natural–2004  Weekly Chart                         Sep 2002 Jun 2002


          Price =  20*eps   2.05    1.80   1.45    1.35    1.25   1.15   1.05   0.93   0.82    0.72   0.68   0.63   0.57   0.51   0.46    0.41    0.36   0.31   0.26   0.23    0.20    0.18    0.15    0.14    0.13    0.11    0.11    0.09    0.08    0.07    0.07    0.06    0.06    0.05    0.05
   209   210   211   212   213   214   215   216   217   218   219