Page 216 - How to Make Money in Stocks Trilogy
P. 216

104  A WINNING SYSTEM


            Price  36  27  23  19  16  13  11  9  7  6  4.6  3.6  2.9  2.5  2.1  1.8  1.5  1.3  1.0  0.8  Volume  30,000,000  16,000,000  8,000,000  4,000,000  2,000,000  © 2009 Investor’s Business Daily, Inc.


                                                         2/1         Jun 2006
                                 eek
                                 eek
                                 k
                                 k
                                 e
                                  e
                                 ee
            Sell: climax top Sell: clima  clima  m  : first volume  first volume  u  v  ecovery off 10-wee  we  1  o  e line  e lin moving average lin  a  v  2/1  Mar 2006
           S&P 500  Sell: : c  e  i  d: f  Add: f  Add:  ecovery off 10-  e  ec  rec  c  n  o  Dec 2005
                                  m
                                 re
                                A
                                                         2/1
                                                        p Volume up  m  Sep 2005
            n
            Market correction  ti  t  r  t c  Mk  k  Buy  Buy  u  -week cup-  -week  k  k  12-week  w  1  dle with-handle with-hand  h  wit  wit  w  w  w  o  Jun 2005 Mar 2005
            n
                                        -
                                        u
            M
                               tion  e                      Big volume on Big volume on  o  m  o  d prior uptrend prior uptrend  u  Dec 2004
                               Earnings accelerat t  c   5/1  B  pr  Sep 2004
                               a
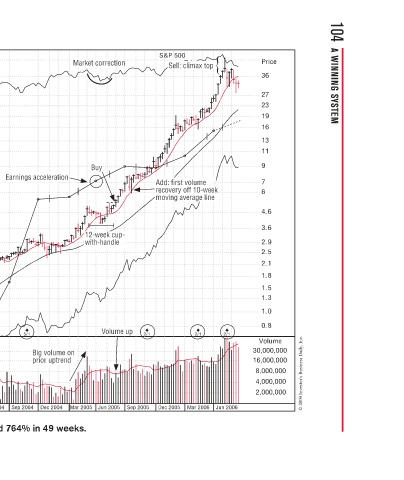
                                                                     Jun 2004 Titanium Metals increased 764% in 49 weeks.
                                                                     Mar 2004

                                                                     Dec 2003

                                                                     Sep 2003

                                                                     Jun 2003

                                                                     Mar 2003 Dec 2002
                                                         1/10

           Titanium Metals–2005  Weekly Chart                        Sep 2002 Jun 2002 Mar 2002


          Price =  20*eps   1.80    1.45    1.35    1.25   1.15   1.05   0.93   0.82    0.72   0.68   0.63   0.57   0.51   0.46    0.41    0.36   0.31    0.26   0.23    0.20    0.18    0.15    0.14    0.13    0.11    0.11    0.09    0.08    0.07    0.07    0.06    0.06    0.05    0.05    0.04
   211   212   213   214   215   216   217   218   219   220   221