
Page 270 - How to Make Money in Stocks Trilogy
P. 270
148 A WINNING SYSTEM
Triple bottoms and head-and-shoulders bottoms are patterns that are
widely mentioned in several books on technical analysis. We have found
these to be weaker patterns as well. A head-and-shoulders bottom may suc-
ceed in a few instances, but it has no strong prior uptrend, which is essential
for most powerful market leaders.
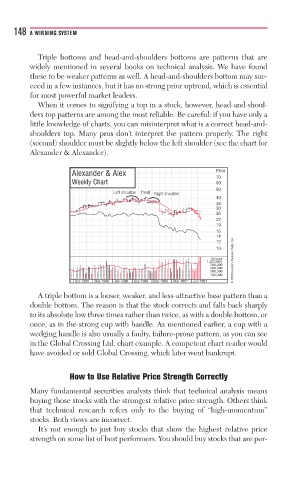
When it comes to signifying a top in a stock, however, head-and-shoul-
ders top patterns are among the most reliable. Be careful: if you have only a
little knowledge of charts, you can misinterpret what is a correct head-and-
shoulders top. Many pros don’t interpret the pattern properly. The right
(second) shoulder must be slightly below the left shoulder (see the chart for
Alexander & Alexander).
Alexander & Alex Price
70
Weekly Chart 60
50
Lefft shoulderdo Heada Right shouldeshoug err
Hd
40
34
30
26
22
19
16
14
12
10
Volume
1,220,000 © 2009 Investor’s Business Daily, Inc.
760,000
480,000
300,000
180,000
Dec 1985 Mar 1986 Jun 1986 Sep 1986 Dec 1986 Mar 1987 Jun 1987
A triple bottom is a looser, weaker, and less-attractive base pattern than a
double bottom. The reason is that the stock corrects and falls back sharply
to its absolute low three times rather than twice, as with a double bottom, or
once, as in the strong cup with handle. As mentioned earlier, a cup with a
wedging handle is also usually a faulty, failure-prone pattern, as you can see
in the Global Crossing Ltd. chart example. A competent chart reader would
have avoided or sold Global Crossing, which later went bankrupt.
How to Use Relative Price Strength Correctly
Many fundamental securities analysts think that technical analysis means
buying those stocks with the strongest relative price strength. Others think
that technical research refers only to the buying of “high-momentum”
stocks. Both views are incorrect.
It’s not enough to just buy stocks that show the highest relative price
strength on some list of best performers. You should buy stocks that are per-