
Page 271 - How to Make Money in Stocks Trilogy
P. 271
How to Read Charts Like a Pro and Improve Your Selection and Timing 149
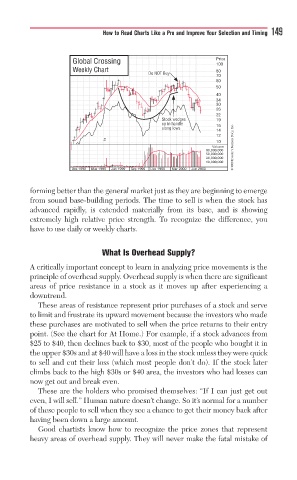
Global Crossing Price
100
Weekly Chart 80
D D Do NOT BuyNOT BNOT y 70
60
50
40
34
30
26
22
Stock 19
Stock wedges wedgesek we
S
u
up in handle en han 16
along lowsl a g g l g low
14
12
10
2/1
Volume © 2009 Investor’s Business Daily, Inc.
80,000,000
50,000,000
30,000,000
18,000,000
Dec 1998 Mar 1999 Jun 1999 Sep 1999 Dec 1999 Mar 2000 Jun 2000
forming better than the general market just as they are beginning to emerge
from sound base-building periods. The time to sell is when the stock has
advanced rapidly, is extended materially from its base, and is showing
extremely high relative price strength. To recognize the difference, you
have to use daily or weekly charts.
What Is Overhead Supply?
A critically important concept to learn in analyzing price movements is the
principle of overhead supply. Overhead supply is when there are significant
areas of price resistance in a stock as it moves up after experiencing a
downtrend.
These areas of resistance represent prior purchases of a stock and serve
to limit and frustrate its upward movement because the investors who made
these purchases are motivated to sell when the price returns to their entry
point. (See the chart for At Home.) For example, if a stock advances from
$25 to $40, then declines back to $30, most of the people who bought it in
the upper $30s and at $40 will have a loss in the stock unless they were quick
to sell and cut their loss (which most people don’t do). If the stock later
climbs back to the high $30s or $40 area, the investors who had losses can
now get out and break even.
These are the holders who promised themselves: “If I can just get out
even, I will sell.” Human nature doesn’t change. So it’s normal for a number
of these people to sell when they see a chance to get their money back after
having been down a large amount.
Good chartists know how to recognize the price zones that represent
heavy areas of overhead supply. They will never make the fatal mistake of