
Page 347 - How to Make Money in Stocks Trilogy
P. 347
M = Market Direction: How You Can Determine It 223
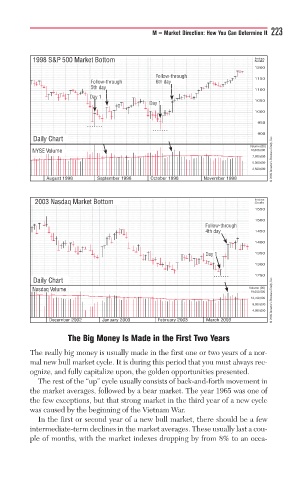
1998 S&P 500 Market Bottom Index
Scale
1200
F F Folloolloollol www-throughthroughthroughh h h h h
F Folloooollowww-throughoug-through h h 6th dayyday y y 1150
6th
5th y
5th daydaydaa
5th
1100
Day 111a y y
D D
Day
1050
D Day
y y
Day 111
D
1000
950
900
Daily Chart
Volume (00)
NYSE Volume 10,000,000
7,500,000 © 2009 Investor’s Business Daily, Inc.
5,000,000
2,500,000
August 1998 September 1998 October 1998 November 1998
2003 Nasdaq Market Bottom Index
Scale
1550
1500
F Folloooollooww-throughoug-throughr h h
4th
4th daydayda
4th y 1450
1400
Day y y 1350
Day 11y
1300
1250
Daily Chart
Nasdaq Volume Volume (00)
19,600,000
14,700,000 © 2009 Investor’s Business Daily, Inc.
9,800,000
4,900,000
December 2002 January 2003 February 2003 March 2003
The Big Money Is Made in the First Two Years
The really big money is usually made in the first one or two years of a nor-
mal new bull market cycle. It is during this period that you must always rec-
ognize, and fully capitalize upon, the golden opportunities presented.
The rest of the “up” cycle usually consists of back-and-forth movement in
the market averages, followed by a bear market. The year 1965 was one of
the few exceptions, but that strong market in the third year of a new cycle
was caused by the beginning of the Vietnam War.
In the first or second year of a new bull market, there should be a few
intermediate-term declines in the market averages. These usually last a cou-
ple of months, with the market indexes dropping by from 8% to an occa-