Page 346 - How to Make Money in Stocks Trilogy
P. 346

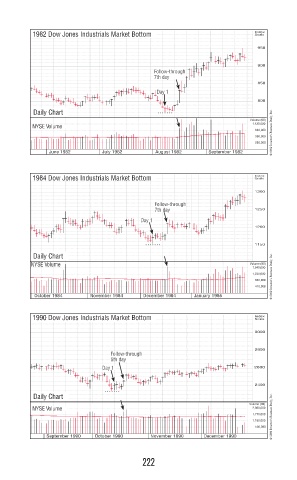
1982 Dow Jones Industrials Market Bottom                    Index
                                                                       Scale
                                                                        950

                                                                        900
                                            F F Folloollolloww-throughthroughthr  h h h h
                                            7th daydayd  y
                                            7th
                                                                        850
                                            Day
                                            Day 11y y y y y y
                                                                        800
           Daily Chart
                                                                      Volume (00)
                                                                      1,120,000
          NYSE Volume
                                                                       840,000 © 2009 Investor’s Business Daily, Inc.
                                                                       560,000
                                                                       280,000
               June 1982     July 1982      August 1982   September 1982


           1984 Dow Jones Industrials Market Bottom                    Index
                                                                       Scale
                                                                       1300
                                            F Folloollooww-throughgthroughr  h h
                                            7th dayday y               1250
                                            7th
                                        Day y
                                        Day 111
                                                                       1200
                                                                       1150
           Daily Chart
          NYSE Volume                                                 Volume (00)
                                                                      1,640,000
                                                                      1,230,000 © 2009 Investor’s Business Daily, Inc.
                                                                       820,000
                                                                       410,000
           October 1984   November 1984  December 1984  January 1985

           1990 Dow Jones Industrials Market Bottom                    Index
                                                                       Scale
                                                                       3000

                                                                       2800
                                F Folloolloo ww-throughthroughgt  h h
                                5th daydayt  y
                                5th
                             Day 11                                    2600
                             Day
                               y
                                                                       2400
           Daily Chart
                                                                     Volume (00)
          NYSE Volume                                                 2,360,000
                                                                      1,770,000 © 2009 Investor’s Business Daily, Inc.
                                                                      1,180,000
                                                                       590,000
              September 1990  October 1990  November 1990  December 1990


                                        222
   341   342   343   344   345   346   347   348   349   350   351