Page 345 - How to Make Money in Stocks Trilogy
P. 345

M = Market Direction: How You Can Determine It 221


            A follow-through signal doesn’t mean you should rush out and buy with
          abandon. It just gives you the go-ahead to begin buying high-quality stocks
          with strong sales and earnings as they break out of sound price bases, and it
          is a vital second confirmation the attempted rally is succeeding.
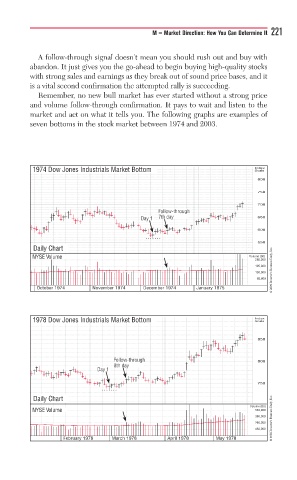
            Remember, no new bull market has ever started without a strong price
          and volume follow-through confirmation. It pays to wait and listen to the
          market and act on what it tells you. The following graphs are examples of
          seven bottoms in the stock market between 1974 and 2003.


           1974 Dow Jones Industrials Market Bottom                    Index
                                                                       Scale
                                                                        800
                                                                        750

                                                                        700
                                             F F Folloollollo ww-throughthroughtht  h h h h g
                                             7th
                                             7th
                                        Day y  7th daydayd  y           650
                                        Day 1111
                                        Day
                                                                        600
                                                                        550
           Daily Chart
                                                                            © 2009 Investor’s Business Daily, Inc.
          NYSE Volume                                                Volume (00)
                                                                       260,000
                                                                       195,000
                                                                       130,000
                                                                        65,000
            October 1974   November 1974  December 1974  January 1975

           1978 Dow Jones Industrials Market Bottom                    Index
                                                                       Scale
                                                                        850


                                 F F Folloollowww-throughthroughu  h h  800
                                 8th
                                 8 8th daydaya y
                            Day y
                            Day 11a
                                                                        750
           Daily Chart
                                                                      Volume (00)
          NYSE Volume                                                  520,000
                                                                       390,000 © 2009 Investor’s Business Daily, Inc.
                                                                       260,000
                                                                       130,000
                   February 1978  March 1978   April 1978   May 1978
   340   341   342   343   344   345   346   347   348   349   350