
Page 42 - How to Make Money in Stocks Trilogy
P. 42
America’s Greatest Stock-Picking Secrets 17
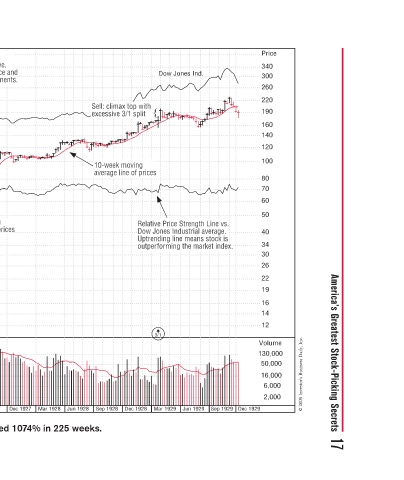
Price 340 300 260 220 190 160 140 120 100 80 70 60 50 40 34 30 26 22 19 16 14 12 Volume 130,000 50,000 16,000 6,000 2,000 © 2009 Investor’s Business Daily, Inc.
Dec 1929
x.
. e L g e t x x n e Sep 1929
Dow Jones Ind. Relative Price Strength Line vs. t e S i e Dow Jones Industrial average. Dow Jones Industrial average t d s n Uptrending line means stock is m e g d outperforming the market index outperforming the market inde a e m o 3/1 Jun 1929 Mar 1929
climax top with w o climax to Sell: climax x x m m excessive 3/1 split ssive 3/1 split i 3 v 10-week moving v m e average line of prices s e o n e t e o e p e u Dec 1928 Sep 1928
exces
exces
exces
e
e
e
-
e
e
S
Jun 1928
Mar 1928
Dec 1927
d u r s. t hi a e t 3 weeks tight Handle drif ftsdown along weekly low prices along weekly low prices c p p y y k Sep 1927 Du Pont de Nemours increased 1074% in 225 weeks.
A leader in science and technology across many g l h d t i c i industries including agriculture, film and automotive. industries including agriculture, film and automotive. f r c Hybridization of seed corn in 1926 by Henry Wallace and 2 o n moisture-proof cellophane were 2 notable achievemen
d
t
Ale
b
i
Market correction n c 4 weeks tight closes g s at moving average line at moving average line n 3 weeks e Buy Buy tight closes tight closes tight closes t - 35-week double bottom- l w handle with-handle with- Shakeout but Shakeout but u never 8% below w % last buy point
o
Du Pont de Nemours–1925 Weekly Chart n n Market correction Market correction o e Sell: climax top o : Add Add Buy last buy 9 weeks k 9 9-week cup- week cup e 9 w in-a -row w w in-a -row with-handle up p p Volume up 13/10 Dec 1925 Sep 1925 Jun 1925 Mar 1925