Page 462 - How to Make Money in Stocks Trilogy
P. 462

332  INVESTING LIKE A PROFESSIONAL


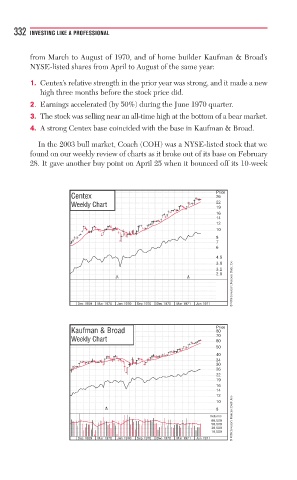
          from March to August of 1970, and of home builder Kaufman & Broad’s
          NYSE-listed shares from April to August of the same year:
          1. Centex’s relative strength in the prior year was strong, and it made a new
             high three months before the stock price did.
          2. Earnings accelerated (by 50%) during the June 1970 quarter.
          3. The stock was selling near an all-time high at the bottom of a bear market.
          4. A strong Centex base coincided with the base in Kaufman & Broad.

            In the 2003 bull market, Coach (COH) was a NYSE-listed stock that we
          found on our weekly review of charts as it broke out of its base on February
          28. It gave another buy point on April 25 when it bounced off its 10-week


                                                            Price
                     Centex                                 26
                     Weekly Chart                           22
                                                            19
                                                            16
                                                            14
                                                            12
                                                            10
                                                            8
                                                            7
                                                            6
                                                            4.5
                                                                 © 2009 Investor’s Business Daily, Inc.
                                                            3.8
                                                            3.2
                                                            2.8
                                 2/1                2/1

                       Dec 1969  Mar 1970  Jun 1970  Sep 1970  Dec 1970  Mar 1971  Jun 1971


                                                            Price
                     Kaufman & Broad                        80
                                                            70
                     Weekly Chart                           60
                                                            50
                                                            40
                                                            34
                                                            30
                                                            26
                                                            22
                                                            19
                                                            16
                                                            14
                                                            12
                                                            10
                              3/2                           8
                                                           Volume  © 2009 Investor’s Business Daily, Inc.
                                                           80,000
                                                           50,000
                                                           30,000
                                                           18,000
                       Dec 1969  Mar 1970  Jun 1970  Sep 1970  Dec 1970  Mar 1971  Jun 1971
   457   458   459   460   461   462   463   464   465   466   467