
Page 463 - How to Make Money in Stocks Trilogy
P. 463
Picking the Best Market Themes, Sectors, and Industry Groups 333
moving average price line. However, this time the new bull market had
begun in earnest after a major market follow-through day in the market
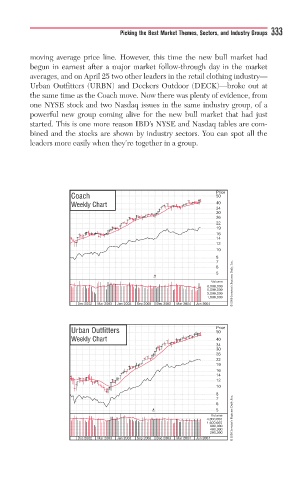
averages, and on April 25 two other leaders in the retail clothing industry—
Urban Outfitters (URBN) and Deckers Outdoor (DECK)—broke out at
the same time as the Coach move. Now there was plenty of evidence, from
one NYSE stock and two Nasdaq issues in the same industry group, of a
powerful new group coming alive for the new bull market that had just
started. This is one more reason IBD’s NYSE and Nasdaq tables are com-
bined and the stocks are shown by industry sectors. You can spot all the
leaders more easily when they’re together in a group.
Price
Coach 50
Weekly Chart 40
34
30
26
22
19
16
14
12
10
8
7
6
5
2/1
Volume
8,000,000 © 2009 Investor’s Business Daily, Inc.
5,000,000
3,000,000
1,800,000
Dec 2002 Mar 2003 Jun 2003 Sep 2003 Dec 2003 Mar 2004 Jun 2004
Urban Outfitters Price
50
Weekly Chart 40
34
30
26
22
19
16
14
12
10
8
7
6
2/1 5
Volume
4,000,000 © 2009 Investor’s Business Daily, Inc.
1,600,000
800,000
400,000
200,000
Dec 2002 Mar 2003 Jun 2003 Sep 2003 Dec 2003 Mar 2004 Jun 2004