
Page 464 - How to Make Money in Stocks Trilogy
P. 464
334 INVESTING LIKE A PROFESSIONAL
Price
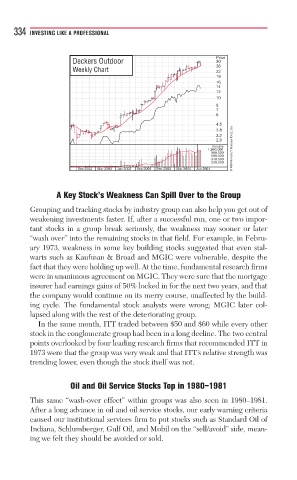
Deckers Outdoor 30
26
Weekly Chart 22
19
16
14
12
10
8
7
6
4.5
3.8
3.2
2.8
Volume
1,660,000 © 2009 Investor’s Business Daily, Inc.
980,000
580,000
340,000
200,000
Dec 2002 Mar 2003 Jun 2003 Sep 2003 Dec 2003 Mar 2004 Jun 2004
A Key Stock’s Weakness Can Spill Over to the Group
Grouping and tracking stocks by industry group can also help you get out of
weakening investments faster. If, after a successful run, one or two impor-
tant stocks in a group break seriously, the weakness may sooner or later
“wash over” into the remaining stocks in that field. For example, in Febru-
ary 1973, weakness in some key building stocks suggested that even stal-
warts such as Kaufman & Broad and MGIC were vulnerable, despite the
fact that they were holding up well. At the time, fundamental research firms
were in unanimous agreement on MGIC. They were sure that the mortgage
insurer had earnings gains of 50% locked in for the next two years, and that
the company would continue on its merry course, unaffected by the build-
ing cycle. The fundamental stock analysts were wrong; MGIC later col-
lapsed along with the rest of the deteriorating group.
In the same month, ITT traded between $50 and $60 while every other
stock in the conglomerate group had been in a long decline. The two central
points overlooked by four leading research firms that recommended ITT in
1973 were that the group was very weak and that ITT’s relative strength was
trending lower, even though the stock itself was not.
Oil and Oil Service Stocks Top in 1980–1981
This same “wash-over effect” within groups was also seen in 1980–1981.
After a long advance in oil and oil service stocks, our early warning criteria
caused our institutional services firm to put stocks such as Standard Oil of
Indiana, Schlumberger, Gulf Oil, and Mobil on the “sell/avoid” side, mean-
ing we felt they should be avoided or sold.