
Page 52 - How to Make Money in Stocks Trilogy
P. 52
22 A WINNING SYSTEM
Price 120 100 80 70 60 50 40 34 30 26 22 19 16 14 12 10 8 7 6 4.5 Volume 3,200 1,600 800 400 © 2009 Investor’s Business Daily, Inc.
x. Jun 1937
. e L g e k t n e
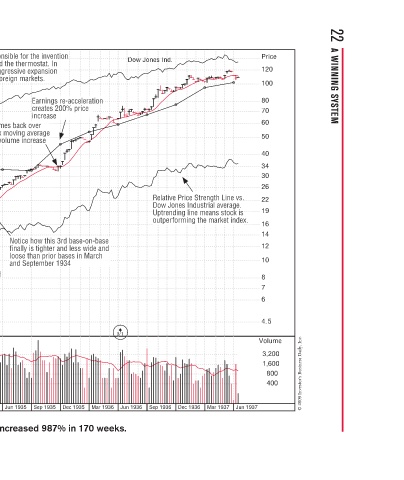
Relative Price Strength Line vs. Relative Price Strength Line vs. t e S c Dow Jones Industrial average. t d n Uptrending line means stock is Uptrending line means stock is s m e outperforming the market index a e i o Mar 1937 Dec 1936
Dow Jones Ind. t e o d e p e u Sep 1936
3/1 Jun 1936
on n on a a n a h M Mar 1936
n on i Earnings re-acceleration Earnings re-acceleratio e a r creates 200% price pr % 0 increase e Notice how this 3rd base-on-base e b 3 finally is tighter and less wide and finally is tighter and less wide and s n loose than prior bases in March n e b 1934 4 and September 1934
Company was responsible for the inventio Company was responsible for the inventio t n w C of the pyrometer and the thermostat. In m m o it began an aggressive expansion 1934, it began an aggressive expansion x g g 1934 strategy, including foreign markets. k o c t Buy: comes back over k
Minneapolis-Honeywell Regulator–1933 Market correction causes o Market correction n c a the base-on-base-on-base - Near low of depression Near low of depression n n es Second quarter of huge e q earnings acceleration ti i l s i Buy u Earnings acceleration e e handle Cup-with-handl
Price = 20*eps 6.00 Weekly Chart 5.50 5.00 4.50 4.00 3.50 3.00 2.50 2.25 o 2.00 on Dow Jones Jo o o o 1.80 1.60 1.50 1.40 1.30 1.20 1.10 1.00 0.90 0.80 0.75 0.70 0.65 0.60 0.55 0.50 g n E 0.45 0.40 0.35 0.30 0.25