
Page 56 - How to Make Money in Stocks Trilogy
P. 56
24 A WINNING SYSTEM
Price 160 140 120 100 80 70 60 50 40 34 30 26 22 19 16 14 12 10 8 7 6 Volume 25,000 10,400 5,000 2,400 © 2009 Investor’s Business Daily, Inc.
Add: bounce back u b d above 10-week e 0 e o moving average line a a n o 4 weeks tight closes e l l ht h ti Sep 1937 Jun 1937
Sell: poor o earnings report t t t o r g i r k e 4 o b n g ease and above o d m Big volume Big volume m l g Mar 1937 Dec 1936
S
e
25-week base e w 25 2 Sell: price closes week below Sell: price closes week below s c r : 10-week moving average line i m e w on volume increase and above on volume incre c u v average weekly volume y l e ge r Add: bounces off 10- f n o week moving average week mo
Buy u eek base a e w a a s o - age e Sep 1936
9-week S e o a A e w i p weeks in a row o a h y y y h Volume up off p o u 10-week line e Mar 1936
Buy Buy B base base Stock up 8 closes, last 2 weeks tiny price spreads from high price spreads from high e up o Dec 1935
Dow Jones Ind. 4 weeks in a row tight 4 weeks in a row tight n t a to low of week w Volume up on e Vou l e breakout week u Sep 1935
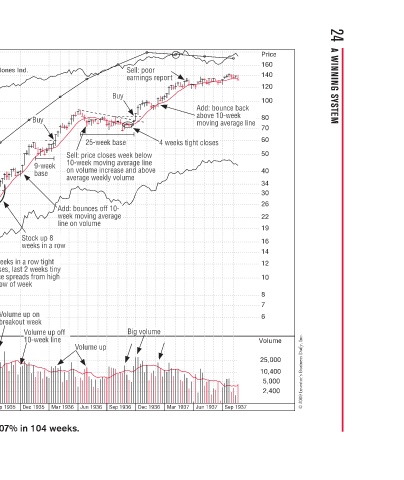
on. t on e h e s s n Buy 4 c p t 2 weeks volume 2 weeks volume m y-up dryp u Jun 1935 Mar 1935 Deere & Co increased 307% in 104 weeks.
One of only a few competitors left standing in the a t w farm equipment industryafter the Great Depressio farm equipment industry after the Great Depressio r af i q Although it was losing money in the midst of the y n g g g Great Depression, Deere gained farmer loyalty by m a n D carryin
Deere & Co.–1935 Weekly Chart Dec 1933 Sep 1933 Jun 1933
Price = 20*eps 7.50 7.00 6.50 6.00 5.50 5.00 4.50 4.00 3.50 3.00 2.50 2.25 2.00 1.80 1.60 1.50 1.40 1.30 1.20 1.10 1.00 0.90 0.80 0.75 0.70 0.65 0.60 0.55 0.50 0.45 0.40 0.35 0.30 0.25