
Page 57 - How to Make Money in Stocks Trilogy
P. 57
© 2009 Investor’s Business Daily, Inc.
Volume
40,000
14,000
2,000
6,000
4.0
7
8
5
6
Sep 1946
Jun 1946
10/7
Mar 1946
Volume increases
s
e
to 10-week moving average
e
Dec 1945
n
g
m
v
g
o
Sep 1945
v
4/3
m
e
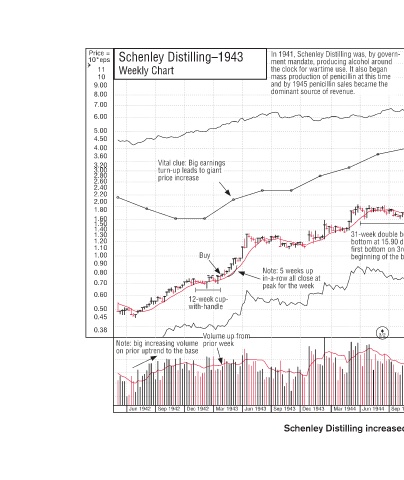
Schenley Distilling increased 1164% in 185 weeks.
Jun 1945
-
Volume up
Mar 1945
m
Dec 1944
Volume up
u
Sep 1944
In 1941, Schenley Distilling was, by govern- Price n e b a tilli Di i l h S S ment mandate, producing alcohol around d ment mandate, producing alcohol around o u n 120 the clock for wartime use. It also began e f Dow Jones Ind. 100 e mass production of penicillin at this time mass pro
3/2
Jun 1944
Mar 1944
Dec 1943
in-a-row all close at
t
Note: 5 weeks up
peak for the week
k
Note: 5 weeks up
w
c
k
th
1941
k f
m
m
d
a
a
t
t
a
I
Jun 1943 Sep 1943
m m Volume up from Volume up from o prior week Mar 1943
Schenley Distilling–1943 Weekly Chart Vital clue: Big earnings Vital clue: Big earnings i e turn-up leads to giant turn-up leads to giant a e price increase r Buy Buy 12-week cup- k with-handle n u o Note: big increasing volume e l re e on prior uptrend to the base e Dec 1942 Sep 1
-
s
s
Price = 10*eps 11 10 9.00 8.00 7.00 6.00 5.00 4.50 4.00 3.60 3.20 3.00 2.80 2.60 2.40 2.20 2.00 1.80 1.60 1.50 1.40 1.30 1.20 1.10 1.00 0.90 0.80 0.70 0.60 0.50 0.45 0.38 e p Jun 1942