
Page 72 - How to Make Money in Stocks Trilogy
P. 72
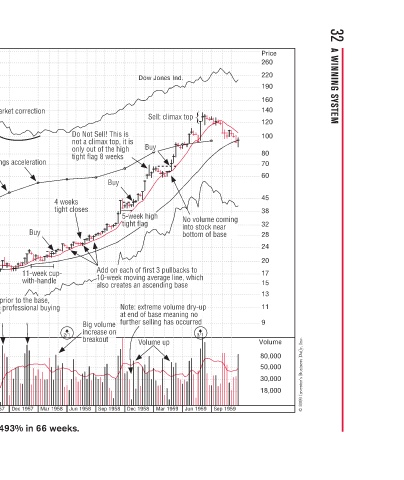
32  A WINNING SYSTEM


          Price  260  220  190  160  140  120  100  80  70  60  45  38  32  28  24  20  17  15  13  11  9  Volume  80,000  50,000  30,000  18,000  © 2009 Investor’s Business Daily, Inc.


                                      g  n                           Sep 1959
                                      No volume coming  o  e  u  into stock near  a nto stock nea  o  o  bottom of base bottom of base  s  m  t  t  h  h  h  dry-up  n  r  3/1  Jun 1959


                     p
              Dow Jones Ind.  Sell: climax top  m  c  Se  y  Buy  y  igh  high  g  g  n each of first 3 pullbacks to   c  b  p  p  t 10-week moving average line, which  g  v creates an ascending base  s  e  Note: extreme volume dry-up Note: extreme volume dr  e  lu  v  m at end of base meaning no   n  a  m  a furth


                         s This is  i  t  p  g  k  y  5-week high  e  5-w  5-w  5 g 5  lag  tight flag  ag  ag  g  g  tight flag  g  i  t  f  o  a  g  v  m also creates an ascending base  a  a  t  t t  Nt  f  d  t  s  e  u  o  Dec 1958
                        Do Not Sell! This is Do Not Sell! Th  l  S  o  not a climax top, it is  x  m  only out of the high   o  tight flag 8 weeks   e  g 8  g  g  ght fl  f  Buy  s  s  d on   Add on  n  d  e  10-we  -  10-  also cr  s  Big volume Big volume  u  v  i  n increase on  e  e  n  breakout t  u  k  k  br


                           g
                           tig
                         o
                                   4 weeks  ks  e  4  tight closes tight closes tight closes  o  t  p  c  handle  d  ng  ng  g  y  2/1  Jun 1958 Mar 1958
                        D
                            n
                            n
                    Market correction Market correction  o  e  Two quarters earnings acceleratio Two quarters earnings acceleratio  i  s  Buy  y  uy  a  11-week cup- 11-week cup-  e  with-handle  h  with  to the base, , ior to the bas  a  o  k  professional buyin professional buyin  o This is large  i  Dec 1957 Sep
                                         Zenith is about to emerge from 2+ year base  o  e  Note: many big volume spikes up prior to t  o  m ke little skyscrapers. This is large profe like little skyscrapers. This is large prof  pers. T ike little skyscrapers  p  p  e  Jun 1957 Mar 1957 Dec 1956


                            w
                            T
                            T


                                                                     Jun 1956 Sep 1956

                                                                     Mar 1956 Dec 1955

           Zenith Radio–1958  Weekly Chart                           Sep 1955 Jun 1955


          Price =  20*eps  12  11  10   9.00   8.00   7.50    7.00   6.50    6.00    5.50    5.00    4.50   4.00   3.50   3.00   2.50   2.25    2.00   1.80   1.60   1.50    1.40    1.30    1.20    1.10    1.00    0.90    0.80    0.75    0.70    0.65    0.60    0.55    0.50    0.45    0.40