
Page 74 - How to Make Money in Stocks Trilogy
P. 74
America’s Greatest Stock-Picking Secrets 33
Price 300 260 220 190 160 140 120 100 80 70 60 50 40 34 30 26 22 19 16 14 12 10 Volume 16,000 8,000 4,000 2,000 © 2009 Investor’s Business Daily, Inc.
th t
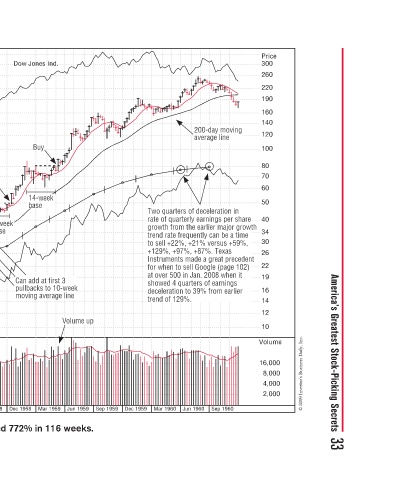
200-day moving o d average line li a n at e e s o m i i ti b +21% versus +59% + u u v s e % r a g g p g h 0 n r f a m f Sep 1960
Two quarters of deceleration in e o e a rate of quarterly earnings per share rate of quarterly earnings per share a y r q growth from the earlier major growt e h m f trend rate frequently can be a time tl t u fr t t to sell +22%, +21% versus +59%, % + % to sel
0
v
q
e
u
o
wt
d
d
d
l
w
w
l
Tw
h
e
t
o
a
o
n
r
tr
Dec 1959
Sep 1959
p Volume up u V Jun 1959
k
e
e
w
l
Dow Jones Ind. y Buy Buy B week 14-week week e e base base s s bas b Can add at first 3 t 3 3 s t fi dd d pullbacks to 10-week t c moving average line g g e g g Mar 1959 Dec 1958
7-week ek e ase C p
Buy y base base base b Volume up as stock goes k through precise buy point, through precise buy point, y also closes week at peak p p t Sep 1958 Jun 1958 Texas Instruments increased 772% in 116 weeks.
Dallas-based leader in new e a semiconductor industry semiconductor industry d d — 1957 Bear Market— k B creates new bases creates new bases s e Buy y u Note volume Note volume handle e 35-week cup-with-handle e h with week cup c 35 treme volume note extreme volume note extreme v
Texas Instruments–1958 Weekly Chart Again note ext n dryup ne dry-up ne p p selling in stock g selling Mar 1957 Dec 1956 Sep 1956
Price = 20*eps 14 13 12 11 10 9.00 8.00 7.50 7.00 6.50 6.00 5.50 5.00 4.50 4.00 3.50 3.00 2.50 2.25 2.00 1.80 1.60 1.50 1.40 1.30 1.20 1.10 1.00 0.90 0.80 0.75 0.70 0.65 0.60 0.55 0.50 Jun 1956