
Page 259 - SK Year 5 Mathematics DLP
P. 259
8 8 DATA HANDLING
D
ANDLING
A
T
A H
INTERPRETING PIE CHARTS
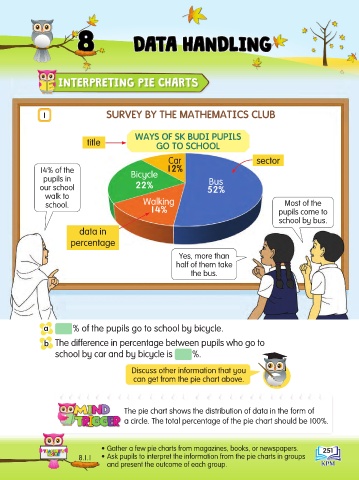
1 SURVEY BY THE MATHEMATICS CLUB
WAYS OF SK BUDI PUPILS
title GO TO SCHOOL
Car sector
14% of the 12%
pupils in Bicycle Bus
our school 22% 52%
walk to
school. Walking Most of the
14% pupils come to
school by bus.
data in
percentage
Yes, more than
half of them take
the bus.
a % of the pupils go to school by bicycle.
b The difference in percentage between pupils who go to
school by car and by bicycle is %.
Discuss other information that you
can get from the pie chart above.
The pie chart shows the distribution of data in the form of
a circle. The total percentage of the pie chart should be 100%.
• Gather a few pie charts from magazines, books, or newspapers. 251
8.1.1 • Ask pupils to interpret the information from the pie charts in groups
and present the outcome of each group.