
Page 44 - TCS ICT Book 7
P. 44
The City School 2021-2022
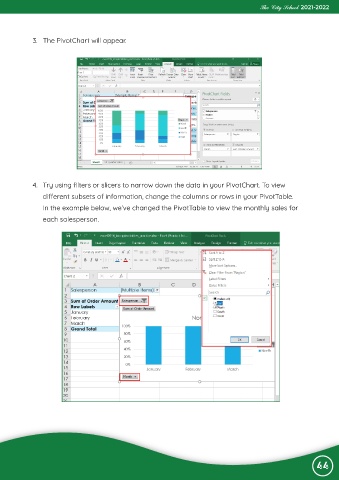
3. The PivotChart will appear.
4. Try using filters or slicers to narrow down the data in your PivotChart. To view
different subsets of information, change the columns or rows in your PivotTable.
In the example below, we’ve changed the PivotTable to view the monthly sales for
each salesperson.
44