
Page 43 - TCS ICT Book 7
P. 43
The City School 2021-2022
Pivot Charts
Pivot Charts are like regular charts, except they display data from a Pivot Table. Just
like regular charts, you’ll be able to select a chart type, layout, and style that will best
represent the data.
Adding Pivot Charts Data Handling
In the example below, our PivotTable is showing a portion of each region’s sales
figures. We’ll use a PivotChart so we can see the information more clearly.
1. Select any cell in your Pivot Table. From the Insert tab, click the PivotChart
command.
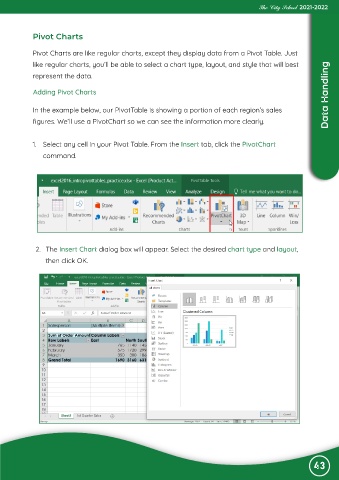
2. The Insert Chart dialog box will appear. Select the desired chart type and layout,
then click OK.
43