
Page 17 - TI Journal 18-1
P. 17
CSF SUPPRESSION METHODS FOR DTI 11
b~0, 3 perpendicular directions at b = 680 s/mm , only b~0 data were eliminated; and 3) the high-b
2
24 intermediate directions at b = 996 s/mm , and scheme in which only the two highest b values were
2
4 tetrahedral directions at b = 1412 s/mm (75). To included. The results for the different schemes are
2
assess the potential effect of CSF PVEs on the decay compared in Figure 2. First, MD measured by the
curve and the exponential nature of the signal decay, standard method was compared to MD from the
signal intensities were graphed as a function of b nobase method in the right superior temporal gray
values for several bilateral ROIs, including perisulcal matter (Figure 2a). Each data point in the scatterplot
gray matter (e.g., superior temporal gray matter), represents a different subject. The deviation from
periventricular gray matter (e.g., caudate), and gray the line of identity is due to the CSF effect. A similar
matter distant from CSF (e.g., putamen). Semilog deviation occurred for the standard versus high-b
plots of the DWI iso signal intensity (geometric means) methods (Figure 2b). In contrast, the nobase and
versus b value in perisylvian gray matter revealed high-b results fell on the line of identity (Figure 2c),
that the b~0 signal was above the straight-line fit of which indicates that the CSF effect was eliminated
the three b ≥ 680 s/mm points (Figure 1). Further, and that the b values between 680-1412 s/mm sam-
2
2
the b ≥ 680 s/mm points were observed to follow ple the same exponential decay curve. The smallest
2
a straight line, indicating that CSF contamination difference across the three different fitting schemes
is a source of non-monoexponential decay in gray was observed for the putamen (1%, d < .4), which
matter that can be suppressed with the removal of was expected given its distal location to CSF areas.
the b~0 data. Importantly, this result also indicates Moderate differences were observed in the caudate
that the remaining data points from b ≥ 680 to 1412 between standard and nobase, and between standard
s/mm followed a monoexponential pattern of decay, and high-b methods (11%, d < .75). Even larger dif-
2
demonstrating that a tensor can be accurately fit to ferences were observed in sulcal gray matter areas
this range of b values without including b~0 data. (15%, d > 1.0). Differences between nobase and
CSF suppression and tissue exponential decay were high-b were negligible for nearly all brain regions
further tested by comparing MD that was calculat- (1-2%), and these minor differences were likely a
ed from the results of three separate tensor-fitting result of the additional random noise caused by the
schemes: 1) the standard scheme in which all four b narrower range of b values in the high-b analyses
values were included; 2) the nobase scheme in which (note that all CSF correction methods have increased
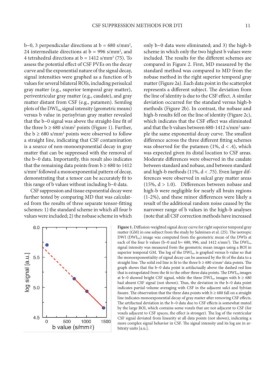
Figure 1. Diffusion-weighted signal decay curve for right superior temporal gray
matter (GM) in one subject from the study by Salminen et al. (25). The isotropic
DWI (DWIiso) image was computed from the geometric mean of the DWIs at
2
each of the four b values (b~0 and b= 680, 996, and 1412 s/mm ). The DWIiso
signal intensity was measured from the geometric mean images using a ROI in
superior temporal GM. The log of the DWIiso is graphed versus b value so that
the monoexponentiality of signal decay can be assessed by the fit of the data to a
straight line. The solid red line is fit to the three b ≥ 680 s/mm data points. The
2
graph shows that the b~0 data point is artifactually above the dashed red line
that is extrapolated from the fit to the other three data points. The DWIiso images
at b~0 showed bright CSF signal, while the three DWIiso images with b ≥ 680
had absent CSF signal (not shown). Thus, the deviation in the b~0 data point
indicates partial volume averaging with CSF in the adjacent sulci and Sylvian
fissure. The observation that the three data points with b ≥ 680 fall on a straight
line indicates monoexponential decay of gray matter after removing CSF effects.
The artifactual deviation in the b~0 data due to CSF effects is somewhat muted
by the large ROI, which contains some voxels that are not adjacent to CSF (for
voxels adjacent to CSF spaces, the effect is stronger). The log of the ventricular
CSF signal deviated from linearity at all data points (not shown), indicating a
more complex signal behavior in CSF. The signal intensity and its log are in ar-
bitraty units [a.u.].