
Page 19 - TI Journal 18-1
P. 19
CSF SUPPRESSION METHODS FOR DTI 13
of b values that exclude the b~0 data. It also enables the combined model in both tracts. Furthermore,
tensor fitting using a reduced number of encoding reducing TR alone did not significantly impact SLF
directions at each b value, thus shortening the scan measurements, suggesting a greater effect of b~0 data
time. on CSF PVEs in white matter.
Recently, Baron and Beaulieu (8) independently The significance of the above two methods that
reported a similar approach to improve the accuracy omit the acquisition or analysis of b~0 is very high.
of DTI tractography using a non-zero b-minimum CSF contamination significantly reduces the accuracy
(b min = 425 s/mm ) and a relatively short TR (TR = of DTI measurements and DTI-based tractography.
2
3.0 s). This study compared the effects of both param- Artificially low FA values in voxels adjacent to CSF
eters on fiber tracking. Specifically, they determined can bias DTI measurements or cause tractography
the effects on pathway volume and diffusion scalar to fail in these regions due to FA falling below the
metrics in pathways vulnerable to CSF PVEs (such tracking threshold (8). DTI measurements and
as the fornix) and also tracts that are less sensitive tractography of white matter fiber bundles, such as
to CSF (such as the superior longitudinal fascicu- the fornix, cingulum, uncinate fasciculus, and cor-
lus, SLF). The combination of a short TR and b min = pus callosum, may be particularly sensitive to CSF
425 s/mm resulted in more than a 50% increase in PVEs given their anatomical proximity to CSF spaces.
2
pathway volume for the crura and body of the fornix, Abnormalities in each of these structures have been
and a 14% increase in SLF volume. As a result, 30% identified in normal aging and in various neurolog-
higher FA and 36% lower MD were observed in the ical conditions (e.g., dementia, multiple sclerosis,
crura. These results are consistent with the trends schizophrenia, etc.) (31,43,96), and accurate DTI
that would be expected if CSF contamination of tis- measurements are critical for understanding the im-
sue voxels were reduced. Percentage increases were plications of these structural alterations. The fornix
not reported using a non-zero b-minimum alone is of particular interest in studies of neurodegener-
without a short TR. DTI accuracy was also improved ative and neuropsychiatric disease, as it is a major
for the body of the fornix and the SLF, though these white matter projection from the hippocampus that
improvements were less robust. Interestingly, us- directly passes through the ventricles. As such, it is
ing a non-zero b-minimum without adjusting TR highly susceptible to CSF contamination and requires
produced nearly equivalent volumetric increases as a corrective technique to remove CSF signal. Few
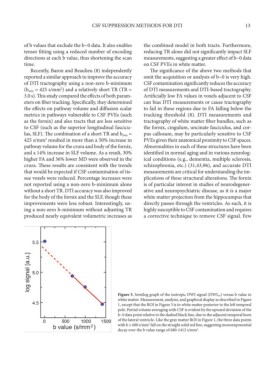
Figure 3. Semilog graph of the isotropic DWI signal (DWIiso) versus b value in
white matter. Measurement, analysis, and graphical display as described in Figure
1, except that the ROI in Figure 3 is in white matter posterior to the left temporal
pole. Partial volume averaging with CSF is evident by the upward deviation of the
b~0 data point relative to the dashed black line, due to the adjacent temporal horn
of the lateral ventricle. Like the gray matter ROI in Figure 1, the three data points
2
with b ≥ 680 s/mm fall on the straight solid red line, suggesting monoexponential
decay over the b value range of 680-1412 s/mm . 2