
Page 73 - Technology and Innovation Journal - 19-1
P. 73
EVENT ANALYTICS FOR INNOVATION 411
Several EventFlow tools were used to clean up and DISCUSSION AND FUTURE DIRECTIONS
simplify the visualization without altering the under- This paper presents a new tool and a novel
lying data model. approach for temporal analysis of innovation trajecto-
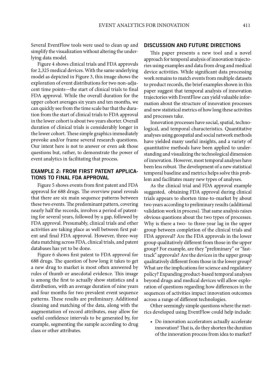
Figure 4 shows clinical trials and FDA approvals ries using examples and data from drug and medical
for 2,325 medical devices. With the same underlying device activities. While significant data processing
model as depicted in Figure 3, this image shows the work remains to match events from multiple datasets
exploration of event distributions for two non-adja- to product records, the brief examples shown in this
cent time points—the start of clinical trials to final paper suggest that temporal analysis of innovation
FDA approval. While the overall duration for the trajectories with EventFlow can yield valuable infor-
upper cohort averages six years and ten months, we mation about the structure of innovation processes
can quickly see from the time scale bar that the dura- and new statistical metrics of how long these activities
tion from the start of clinical trials to FDA approval and processes take.
in the lower cohort is about two years shorter. Overall Innovation processes have social, spatial, techno-
duration of clinical trials is considerably longer in logical, and temporal characteristics. Quantitative
the lower cohort. These simple graphics immediately analyses using geospatial and social network methods
provoke and/or frame several research questions. have yielded many useful insights, and a variety of
Our intent here is not to answer or even ask those quantitative methods have been applied to under-
questions but, rather, to demonstrate the power of standing and visualizing the technological dimension
event analytics in facilitating that process. of innovation. However, most temporal analyses have
been less robust. The development of a new statistical
EXAMPLE 2: FROM FIRST PATENT APPLICA- temporal baseline and metrics helps solve this prob-
TIONS TO FINAL FDA APPROVAL lem and facilitates many new types of analyses.
Figure 5 shows events from first patent and FDA As the clinical trial and FDA approval example
approval for 688 drugs. The overview panel reveals suggested, obtaining FDA approval during clinical
that there are six main sequence patterns between trials appears to shorten time-to-market by about
these two events. The predominant pattern, covering two years according to preliminary results (additional
nearly half the records, involves a period of patent- validation work in process). That same analysis raises
ing for several years, followed by a gap, followed by obvious questions about the two types of processes.
FDA approval. Presumably, clinical trials and other Why is there a two- to three-year lag in the upper
activities are taking place as well between first pat- group between completion of the clinical trials and
ent and final FDA approval. However, three-way FDA approval? Are the FDA approvals in the lower
data matching across FDA, clinical trials, and patent group qualitatively different from those in the upper
databases has yet to be done. group? For example, are they “preliminary” or “fast-
Figure 6 shows first patent to FDA approval for track” approvals? Are the devices in the upper group
688 drugs. The question of how long it takes to get qualitatively different from those in the lower group?
a new drug to market is most often answered by What are the implications for science and regulatory
rules of thumb or anecdotal evidence. This image policy? Expanding product-based temporal analyses
is among the first to actually show statistics and a beyond drugs and medical devices will allow explo-
distribution, with an average duration of nine years ration of questions regarding how differences in the
and four months for two prevalent event sequence sequences of activities impact innovation outcomes
patterns. These results are preliminary. Additional across a range of different technologies.
cleaning and matching of the data, along with the Other seemingly simple questions where the met-
augmentation of record attributes, may allow for rics developed using EventFlow could help include:
useful confidence intervals to be generated by, for
example, segmenting the sample according to drug • Do innovation accelerators actually accelerate
class or other attributes. innovation? That is, do they shorten the duration
of the innovation process from idea to market?