
Page 216 - MARSIUM'21 COMP OF PAPER
P. 216
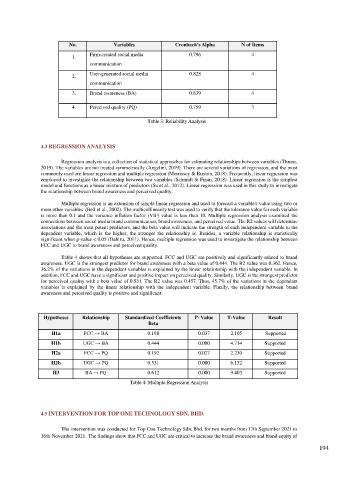
No.             Variables             Cronbach’s Alpha       N of Items

                          1.     Firm-created social media          0.796                4
                                 communication

                                 User-generated social media        0.828                4
                          2.
                                 communication
                          3.     Brand awareness (BA)               0.839                4

                          4.     Perceived quality (PQ)             0.759                3

                                                     Table 3: Reliability Analysis


               4.3 REGRESSION ANALYSIS

                       Regression analysis is a collection of statistical approaches for estimating relationships between variables (Thrane,
               2019). The variables are not treated symmetrically (Angelini, 2019). There are several variations of regression, and the most
               commonly used are linear regression and multiple regression (Morrissey & Ruxton, 2018). Frequently, linear regression was
               employed to investigate the relationship between two variables (Schmidt & Finan, 2018). Linear regression is the simplest
               model and functions as a linear mixture of predictors (Su et al., 2012). Linear regression was used in this study to investigate
               the relationship between brand awareness and perceived quality.

                       Multiple regression is an extension of simple linear regression and used to forecast a variable's value using two or
               more other variables  (Bell et al., 2002). The multicollinearity test was used to verify that the tolerance value for each variable
               is more than 0.1 and the variance inflation factor (VIF) value is less than 10. Multiple regression analysis examined the
               connections between social media brand communication, brand awareness, and perceived value. The R2 values will determine
               associations and the most potent predictors, and the beta value will indicate the strength of each independent variable to the
               dependent  variable,  which  is  the  higher,  the  stronger  the  relationship  is.  Besides,  a  variable  relationship  is  statistically
               significant when p-value < 0.05 (Dahiru, 2011). Hence, multiple regression was used to investigate the relationship between
               FCC and UGC to brand awareness and perceived quality.

                       Table 4 shows that all hypotheses are supported. FCC and UGC are positively and significantly related to brand
               awareness. UGC is the strongest predictor for brand awareness with a beta value of 0.444. The R2 value was 0.362. Hence,
               36.2% of the variations in the dependant variables is explained by the linear relationship with the independent variable. In
               addition, FCC and UGC have a significant and positive impact on perceived quality. Similarly, UGC is the strongest predictor
               for perceived quality with a beta value of 0.531. The R2 value was 0.457. Thus, 45.7% of the variations in the dependant
               variables  is  explained  by  the  linear  relationship  with  the  independent  variable.  Finally,  the  relationship  between  brand
               awareness and perceived quality is positive and significant.


                Hypotheses    Relationship   Standardized Coefficients   P- Value   T-Value    Result
                                                     Beta
                   H1a        FCC → BA               0.198             0.037      2.105       Supported

                   H1b        UGC → BA               0.444             0.000      4.714       Supported
                   H2a         FCC → PQ              0.192             0.027      2.230       Supported
                   H2b        UGC → PQ               0.531             0.000      6.152       Supported
                    H3         BA → PQ               0.612             0.000      9.403       Supported
                                               Table 4: Multiple Regression Analysis


               4.5 INTERVENTION FOR TOP ONE TECHNOLOGY SDN. BHD.

                       The intervention was conducted for Top One Technology Sdn. Bhd. for two months from 17th September 2021 to
               16th November 2021. The findings show that FCC and UGC are critical to increase the brand awareness and brand equity of

                                                                                                                 194