
Page 215 - MARSIUM'21 COMP OF PAPER
P. 215
Self-employed 9 6.0
Retired 1 0.7
Full-time student
89 59.3
6. Daily social media Less than 1 hour 9 6.0
usage
1 – 2 hours 26 17.4
2 – 4 hours 53 35.3
More than 4 hours 62 41.3
Table 1: Profile of Respondents
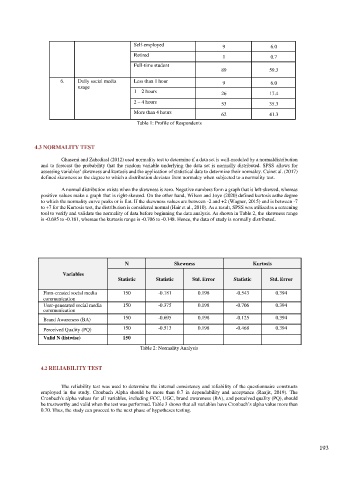
4.3 NORMALITY TEST
Ghasemi and Zahediasl (2012) used normality test to determine if a data set is well-modeled by a normal distribution
and to forecast the probability that the random variable underlying the data set is normally distributed. SPSS allows for
assessing variables’ skewness and kurtosis and the application of statistical data to determine their normalcy. Cain et al. (2017)
defined skewness as the degree to which a distribution deviates from normalcy when subjected to a normality test.
A normal distribution exists when the skewness is zero. Negative numbers form a graph that is left-skewed, whereas
positive values make a graph that is right-skewed. On the other hand, Wilson and Joye (2020) defined kurtosis as the degree
to which the normality curve peaks or is flat. If the skewness values are between -2 and +2 (Wagner, 2015) and is between -7
to +7 for the Kurtosis test, the distribution is considered normal (Hair et al., 2010). As a result, SPSS was utilized as a screening
tool to verify and validate the normality of data before beginning the data analysis. As shown in Table 2, the skewness range
is -0.695 to -0.181, whereas the kurtosis range is -0.706 to -0.148. Hence, the data of study is normally distributed.
N Skewness Kurtosis
Variables
Statistic Statistic Std. Error Statistic Std. Error
Firm-created social media 150 -0.181 0.198 -0.543 0.394
communication
User-generated social media 150 -0.375 0.198 -0.706 0.394
communication
Brand Awareness (BA) 150 -0.695 0.198 -0.125 0.394
Perceived Quality (PQ) 150 -0.513 0.198 -0.468 0.394
Valid N (listwise) 150
Table 2: Normality Analysis
4.2 RELIABILITY TEST
The reliability test was used to determine the internal consistency and reliability of the questionnaire constructs
employed in the study. Cronbach Alpha should be more than 0.7 in dependability and acceptance (Ranjit, 2019). The
Cronbach's alpha values for all variables, including FCC, UGC, brand awareness (BA), and perceived quality (PQ), should
be trustworthy and valid when the test was performed. Table 3 shows that all variables have Cronbach’s alpha value more than
0.70. Thus, the study can proceed to the next phase of hypotheses testing.
193