
Page 214 - MARSIUM'21 COMP OF PAPER
P. 214
The survey questions were adapted from Schivinski and Dabrowski's (2015) using a five-point Likert scale. Links
to surveys were distributed by direct messages to WhatsApp and Facebook users to encourage them to participate in the
research. The invitation to the questionnaire included information about the objectives of the study. A brief example was given
to assist respondents in differentiating between two distinct sorts of social media brand communications. In Part C of the
questionnaire, a 5-point Likert Scale was used, ranging from 1 (Strongly Disagree) to 2 (Disagree), 3 (Neutral), 4 (Agree), and
finally 5 (Strongly Agree). Data was reviewed, processed, and analyzed following data collection using the Statistical Package
for the Social Sciences (SPSS).
⬛ 4.0 FINDING AND ANALYSIS
This section analyses and summarizes the survey findings on social media brand communication to increase brand
equity (brand awareness and perceived quality) of electrical component retailers. This study primarily employed three types
of analysis: normality, reliability, and multiple regression.
4.1 RESPONSE RATE
The survey was distributed to respondents through social media such as WhatsApp, Facebook, Instagram, and
LinkedIn. The population of study was composed of Facebook users in Malaysia who had liked or followed any electronic
components retailers page or product before. Out of 217 responses, 67 responses were rejected due to respondents did not
fulfill the qualifying requirement for the study. Hence, 150 was usable for data analysis and recorded a response rate of 69.12
%.
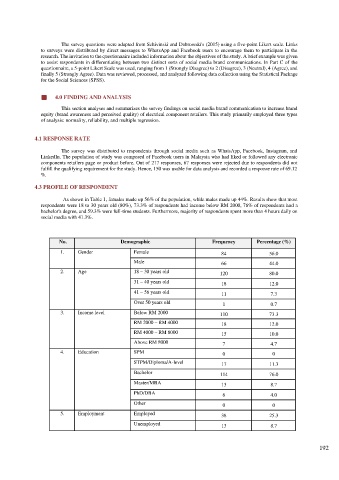
4.3 PROFILE OF RESPONDENT
As shown in Table 1, females made up 56% of the population, while males made up 44%. Results show that most
respondents were 18 to 30 years old (80%), 73.3% of respondents had income below RM 2000, 76% of respondents had a
bachelor's degree, and 59.3% were full-time students. Furthermore, majority of respondents spent more than 4 hours daily on
social media with 41.3%.
No. Demographic Frequency Percentage (%)
1. Gender Female 84 56.0
Male 66 44.0
2. Age 18 – 30 years old 120 80.0
31 – 40 years old 18 12.0
41 – 56 years old 11 7.3
Over 50 years old 1 0.7
3. Income level Below RM 2000 110 73.3
RM 2000 – RM 4000 18 12.0
RM 4000 – RM 8000 15 10.0
Above RM 8000 7 4.7
4. Education SPM 0 0
STPM/Diploma/A-level 17 11.3
Bachelor 114 76.0
Master/MBA 13 8.7
PhD/DBA 6 4.0
Other 0 0
5. Employment Employed 38 25.3
Unemployed 13 8.7
192