
Page 102 - ANUAL REPORT MOH 2017
P. 102
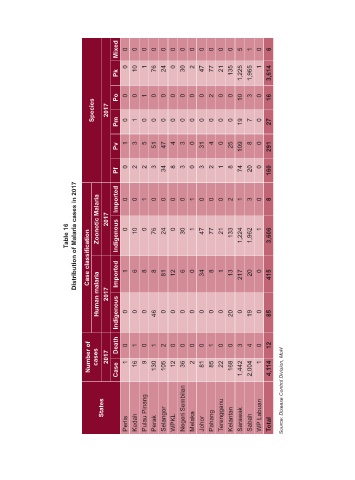
Mixed  0  0  0  0  0  0  0  0  0  0  0  0  5  1  0  6


                                          0  10  1  76  24  0  30  2  47  77  21    1
                                       Pk                                  135  1,225  1,965  3,614


                                       Po  0  0  1  0  0  0  0  0  0  2  0  0  10  3  0  16
                               Species  2017  Pm  0  1  0  0  0  0  0  0  0  0  0  0  19  7  0  27


                                       Pv  1  3  5  51  47  4  3  0  31  4  0  25  109  8  0  291


                                          0  2  2  3     8  3  0  3  2  1  8        0
                                       Pf  Imported  0  0  1  0  34  0  0  0  1  0  0  0  2  74  1  20  3  0  160  8


                       Table 16 Distribution of Malaria cases in 2017  Case classification  Zoonotic Malaria  2017  Indigenous  0  10  0  76  24  0  30  1  47  77  21  133  1,224  1,962  1  3,606


                                 Human malaria  2017  Imported Indigenous  1  0  6  0  8  0  8  46  81  0  12  0  6  0  0  0  34  0  8  0  1  0  13  20  217  0  20  19  0  0  415  85


                              Number of   cases  2017  Death  Case  0  1  1  16  0  9  1  130  2  105  0  12  0  36  0  2  0  81  1  85  0  22  0  168  3  1,442  4  2,004  0  1  12  4,114


                                  States        Pulau Pinang  Negeri Sembilan  Terengganu  WP Labuan  Source: Disease Control Division, MoH


                                          Perlis  Kedah  Perak  Selangor  WPKL  Melaka  Johor  Pahang  Kelantan  Sarawak  Sabah  Total