
Page 212 - ANUAL REPORT MOH 2017
P. 212
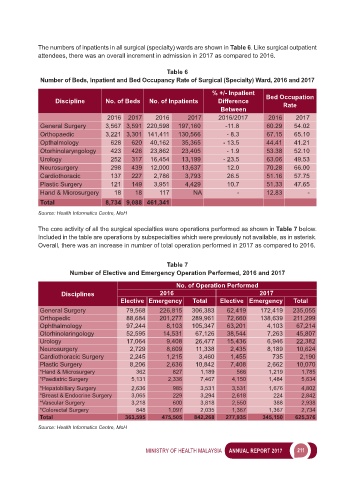
The numbers of inpatients in all surgical (specialty) wards are shown in Table 6. Like surgical outpatient
             attendees, there was an overall increment in admission in 2017 as compared to 2016.


                                                      Table 6
              Number of Beds, Inpatient and Bed Occupancy Rate of Surgical (Specialty) Ward, 2016 and 2017

                                                                     % +/- Inpatient   Bed Occupation
                   Discipline      No. of Beds   No. of Inpatients     Difference          Rate
                                                                       Between
                                   2016   2017     2016      2017      2016/2017       2016     2017
              General Surgery      3,567 3,591 220,598   197,160         -11.8        60.29     54.02
              Orthopaedic          3,221 3,301 141,411   130,566         - 8.3        67.15     65.10
              Opthalmology          628     620  40,162     35,365      - 13.5        44.41    41.21
              Otorhinolaryngology   423    426   23,862     23,405       - 1.9        53.38    52.10
              Urology               252    317   16,454     13,199      - 23.5        63.06    49.53
              Neurosurgery          298    439   12,000     13,637        12.0        70.28    66.00
              Cardiothoracic        137    227    2,786     3,793         26.5        51.16    57.75
              Plastic Surgery       121    149    3,951     4,429         10.7        51.33    47.65
              Hand & Microsurgery    18      18     117        NA            -        12.83        -
              Total                8,734 9,088 461,341
             Source: Health Informatics Centre, MoH

             The core activity of all the surgical specialties were operations performed as shown in Table 7 below.
             Included in the table are operations by subspecialties which were previously not available, as in asterisk.
             Overall, there was an increase in number of total operation performed in 2017 as compared to 2016.


                                                      Table 7
                       Number of Elective and Emergency Operation Performed, 2016 and 2017
                                                         No. of Operation Performed
                     Disciplines                    2016                            2017
                                        Elective Emergency     Total   Elective Emergency      Total
              General Surgery            79,568     226,815   306,383    62,419     172,419    235,055
              Orthopedic                 88,684     201,277   289,961    72,660     138,639    211,299
              Ophthalmology              97,244       8,103   105,347    63,201         4,103    67,214
              Otorhinolaringology        52,595      14,531    67,126     38,544        7,263    45,807
              Urology                    17,064       9,408    26,477     15,436        6,946   22,382
              Neurosurgery                2,729       8,609     11,338     2,435        8,189   10,624
              Cardiothoracic Surgery      2,245       1,215      3,460     1,455          735     2,190
              Plastic Surgery             8,206       2,636    10,842      7,408        2,662     10,070
              *Hand & Microsurgery          362         827      1,189        566      1,219     1,785
              *Paediatric Surgery          5,131       2,336     7,467     4,150       1,484      5,634
              *Hepatobiliary Surgery       2,636        985      3,531     3,531       1,676     4,802
              *Breast & Endocrine Surgery  3,065        229      3,294     2,618        224      2,842
              *Vascular Surgery            3,218        600      3,818     2,550        388      2,938
              *Colorectal Surgery           848        1,097     2,035     1,367       1,367     2,734
              Total                      363,595     475,505   842,268   277,935     345,150   625,376
             Source: Health Informatics Centre, MoH


                                                MINISTRY OF HEALTH MALAYSIA     ANNUAL REPORT 2017       211