
Page 351 - ANUAL REPORT MOH 2017
P. 351
To further enhance the effectiveness of the programme, a Quality Assurance Programme (QAP) for
NDWQSP was launched in December 1992 and implemented nationwide in January 1993. The QAP
standards is set based on five (5) performance indicators, i.e. Free Residual Chlorine, E. coli, Combine
Free Residual Chlorine and E. coli, Turbidity and Aluminium. The standards are revised each year so
that it can be made more stringent to be consistent with any improvement of the national annual average.
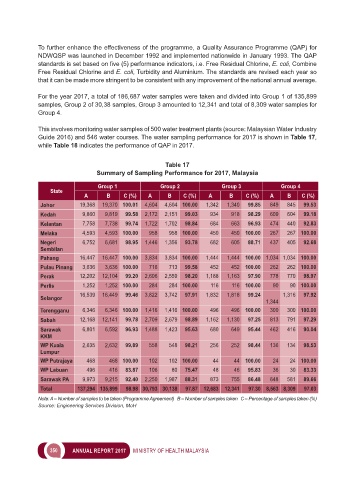
For the year 2017, a total of 186,687 water samples were taken and divided into Group 1 of 135,899
samples, Group 2 of 30,38 samples, Group 3 amounted to 12,341 and total of 8,309 water samples for
Group 4.
This involves monitoring water samples of 500 water treatment plants (source: Malaysian Water Industry
Guide 2016) and 546 water courses. The water sampling performance for 2017 is shown in Table 17,
while Table 18 indicates the performance of QAP in 2017.
Table 17
Summary of Sampling Performance for 2017, Malaysia
Group 1 Group 2 Group 3 Group 4
State
A B C (%) A B C (%) A B C (%) A B C (%)
Johor 19,368 19,370 100.01 4,604 4,604 100.00 1,342 1,340 99.85 849 845 99.53
Kedah 9,860 9,819 99.58 2,172 2,151 99.03 934 918 98.29 609 604 99.18
Kelantan 7,758 7,738 99.74 1,722 1,702 98.84 684 663 96.93 474 440 92.83
Melaka 4,593 4,593 100.00 958 958 100.00 450 450 100.00 267 267 100.00
Negeri 6,752 6,681 98.95 1,446 1,356 93.78 682 605 88.71 437 405 92.68
Sembilan
Pahang 16,447 16,447 100.00 3,834 3,834 100.00 1,444 1,444 100.00 1,034 1,034 100.00
Pulau Pinang 3,636 3,636 100.00 716 713 99.58 452 452 100.00 262 262 100.00
Perak 12,202 12,104 99.20 2,606 2,559 98.20 1,188 1,163 97.90 778 770 98.97
Perlis 1,252 1,252 100.00 284 284 100.00 116 116 100.00 90 90 100.00
16,539 16,449 99.46 3,822 3,742 97.91 1,832 1,818 99.24 1,316 97.92
Selangor
1,344
Terengganu 6,346 6,346 100.00 1,416 1,416 100.00 496 496 100.00 300 300 100.00
Sabah 12,168 12,141 99.78 2,709 2,679 98.89 1,162 1,130 97.25 813 791 97.29
Sarawak 6,801 6,592 96.93 1,488 1,423 95.63 680 649 95.44 462 416 90.04
KKM
WP Kuala 2,635 2,632 99.89 558 548 98.21 256 252 98.44 136 134 98.53
Lumpur
WP Putrajaya 468 468 100.00 102 102 100.00 44 44 100.00 24 24 100.00
WP Labuan 496 416 83.87 106 80 75.47 48 46 95.83 36 30 83.33
Sarawak PA 9,973 9,215 92.40 2,250 1,987 88.31 873 755 86.48 648 581 89.66
Total 137,294 135,899 98.98 30,793 30,138 97.87 12,683 12,341 97.30 8,563 8,309 97.03
Note: A – Number of samples to be taken (Programme Agreement) B – Number of samples taken C – Percentage of samples taken (%)
Source: Engineering Services Division, MoH
350 ANNUAL REPORT 2017 MINISTRY OF HEALTH MALAYSIA