
Page 22 - Bi-National Socioeconomic Handbook 2020 Laredos Region
P. 22
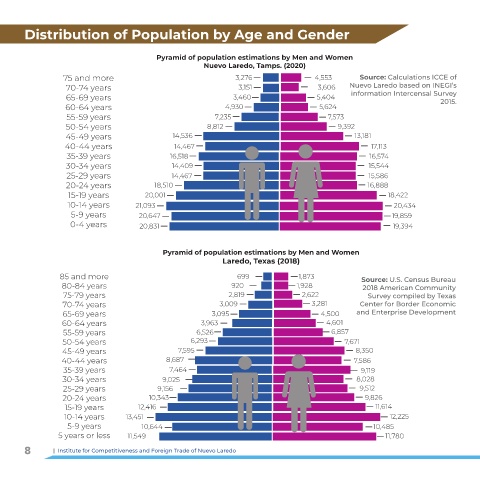
Distribution of Population by Age and Gender


                                               Pyramid of population estimations by Men and Women
                                                             Nuevo Laredo, Tamps. (2020)
                    75 and more                                        3,276                  4,553        Source: Calculations ICCE of
                     70-74 years                                       3,151                   3,606    Nuevo Laredo based on INEGI’s
                     65-69 years                                      3,460                    5,404     information Intercensal Survey
                                                                                                                                   2015.
                    60-64 years                                     4,930                      5,624
                     55-59 years                                7,235                             7,573
                    50-54 years                               8,812                                  9,392
                    45-49 years                     14,536                                                13,181
                    40-44 years                     14,467                                                     17,113
                     35-39 years                   16,518                                                     16,574
                    30-34 years                     14,409                                                    15,544
                     25-29 years                    14,467                                                    15,586
                    20-24 years                18,510                                                         16,888
                     15-19 years            20,001                                                                  18,422
                     10-14 years         21,093                                                                      20,434
                      5-9 years           20,647                                                                     19,859
                      0-4 years           20,831                                                                     19,394


                                                 Pyramid of population estimations by Men and Women
                                                                   Laredo, Texas (2018)

                   85 and more                                         699               1,873              Source: U.S. Census Bureau
                   80-84 years                                       920                 1,928              2018 American Community
                    75-79 years                                      2,819                2,622               Survey compiled by Texas
                    70-74 years                                   3,009                      3,281         Center for Border Economic
                    65-69 years                                 3,095                           4,500     and Enterprise Development
                   60-64 years                              3,963                                4,601
                    55-59 years                            6,526                                   6,857
                   50-54 years                           6,293                                         7,671
                   45-49 years                        7,595                                               8,350
                   40-44 years                    8,687                                                   7,586
                    35-39 years                    7,464                                                    9,119
                   30-34 years                   9,025                                                    8,028
                    25-29 years                 9,156                                                      9,512
                   20-24 years               10,343                                                          9,826
                    15-19 years           12,416                                                                11,614
                    10-14 years       13,451                                                                        12,225
                     5-9 years             10,644                                                              10,485
                  5 years or less      11,549                                                                      11,780

        8        |  Institute for Competitiveness and Foreign Trade of Nuevo Laredo