
Page 18 - FMT April
P. 18
Ingredients
Nutrition vs Functionality – The Indian
Context for Protein Ingredients
By Dr. Kaushik Ramakrishnan*
he macromolecules critical of the large vegetarian/fl exitarian to 60.7 grams per day. Haryana
for a balanced diet are population, but also because Indian remained the topper in 2011/12
Tcarbohydrates, proteins, and cuisine does not place meat on the too. This survey also revealed that
fats. Of these, there is an excess of centre of plate. Even centre of plate cereals contributed most to protein
carbohydrate and fat consumption, dishes like a biriyani do not contain consumption (49-58% rural to
while proteins remain defi cient. meat as a major component, with urban). Milk was 10-12% and meat/
This is a general trend around the rice predominating the volume. In fish/egg were 7-9%. The growth
world and has led to a focus on this context, evaluating the choices of dairy and meat/fi sh/eggs has
the protein composition of diets. that individuals have for ensuring been at the cost of cereals which
Increased protein consumption can adequate protein consumption is have fallen from a high of 72%
be achieved through the balancing necessary to determine the potential in 1993. The divide in nutritional
of different food groups or by for protein ingredients in India. intake is also seen between rural
fortification of processed foods with and urban populations, with urban
protein ingredients. Giract defi nes NUTRITIONAL STATUS OF populations faring better. Similarly
protein ingredients as those that DEMOGRAPHIES IN INDIA VIS-À- poor households fare worse than
exceed a protein content of 50%, VIS PROTEIN relatively affl uent counterparts.
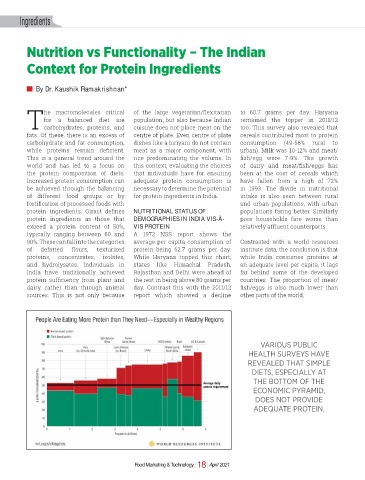
typically ranging between 60 and A 1972 NSS report shows the
90%. These can fall into the categories average per capita consumption of Contrasted with a world resources
of defatted fl ours, texturized protein being 62.7 grams per day. institute data, the conclusion is that
proteins, concentrates, isolates, While Haryana topped this chart, while India consumes proteins at
and hydrolysates. Individuals in states like Himachal Pradesh, an adequate level per capita, it lags
India have traditionally achieved Rajasthan and Delhi were ahead of far behind some of the developed
protein sufficiency from plant and the rest in being above 80 grams per countries. The proportion of meat/
dairy, rather than through animal day. Contrast this with the 2011/12 fish/eggs is also much lower than
sources. This is not only because report which showed a decline other parts of the world.
VARIOUS PUBLIC
HEALTH SURVEYS HAVE
REVEALED THAT SIMPLE
DIETS, ESPECIALLY AT
THE BOTTOM OF THE
ECONOMIC PYRAMID,
DOES NOT PROVIDE
ADEQUATE PROTEIN.
Food Marketing & Technology 18 April 2021