Page 112 - The Atlas of Economic Complexity
P. 112

MAPPING PATHS TO PROSPERITY  |  113


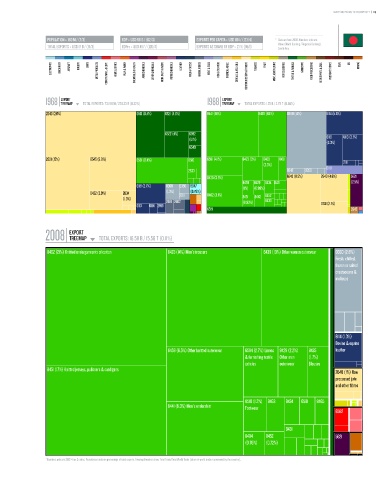
                   POPULATION ≥ 160 M / (7/3)  GDP ≥ USD 80 b / (62/3)    EXPORTS PER CAPITA ≥ USD 104 / (123/4)  *   Data are from 2008. Numbers indicate:
                                                                                                          value (World Ranking / Regional Ranking).
                   TOTAL EXPORTS ≥ USD 17 b / (71/3)  GDPpc ≥ USD 497 / (120/4)  EXPORTS AS SHARE OF GDP ≥ 21 % (95/1)    South Asia.

                    ELECTRONICS  MACHINERY  AIRCRAFT   bOILERS   SHIPS   METAL PRODUCTS  CONSTR. MATL. & EqPT.  HOME & OFFICE  PULP & PAPER  CHEMICALS & HEALTH  AGROCHEMICALS  OTHER CHEMICALS  INOR. SALTS & ACIDS  PETROCHEMICALS  LEATHER  MILK & CHEESE  ANIMAL FIbERS  MEAT & EGGS  FISH & SEAFOOD  TROPICAL AGRIC.  CEREALS & vEG. OILS  COTTON/RICE/SOY & OTHERS  TObACCO  FRUIT  MISC. AGRICULTURE  NOT CLASSIFIED  TEXTILE & FAbRICS  GARMENTS  FOOD PROCESSING  bEER/SPIRITS & CIGS.  PRECIOUS STONES  COAL  OIL  MINING


                        EXPORT                                                      EXPORT
                  1968 TREEMAP  TOTAL EXPORTS: 731.88 M / 228.33 b (0.32%)    1988 TREEMAP  TOTAL EXPORTS: 1.25 b / 2.79 T (0.04%)
                                        Total Exports: 731.88 M / 228.33 B (0.32%)                   Total Exports: 1.25 B / 2.79 T (0.04%)
                  2640 (26%)                        6513 (8.4%)  6521 (4.6%)  8441 (15%)         8439 (8.1%)  0360 (14%)   6114 (5.3%)


                                                              6522 (4%)  6592
                                                                       (1.1%)                                              6116  6113 (3.1%)
                                                                                                                           (3.3%)
                                                                       6549
                  2631 (15%)       6545 (9.9%)      6581 (8.4%)        8510   6581 (4.1%)  8423 (3%)  8463  8431                 2111
                                                                                                   (2.3%)
                                                                       2633                                 0342   0350    0118
                                                                              8435 (3.9%)                   6545 (8.5%)  2640 (4.6%)  5621
                                                                                           8459  8429  8434 8421                    (2.5%)
                                                    6118 (3.7%)  0360  0350 8947           (1%)  (0.99%)
                                   0422 (3.9%)  2634           (1.3%)  2911  (0.76%)  8462 (3.1%)   8452
                                               (1.3%)                                      8451  8443
                                                               2681 2682                   (0.93%)  8433
                                                    6113  6114 2919                                                     0741 (2.1%)
                                                                              6519                                                  0545


                           EXPORT
                  2008 TREEMAP        TOTAL EXPORTS: 16.58 b / 15.56 T (0.11%)
                                                                 Total Exports: 16.58 B / 15.56 T (0.11%)
                   8462 (21%) Knitted undergarments of cotton  8423 (14%) Men's trousers           8439 (10%) Other women outerwear  0360 (2.8%)
                                                                                                                              Fresh, chilled,
                                                                                                                              frozen or salted
                                                                                                                              crustaceans &
                                                                                                                              molluscs


                                                                                                                              6114 (1.3%)
                                                                                                                              Bovine & equine
                                                               8459 (6.5%) Other knitted outerwear  6584 (2.7%) Linens  8429 (2.2%)  8435  leather
                                                                                            & furnishing textile  Other men  (1.7%)
                                                                                            articles     outerwear  Blouses
                   8451 (17%) Knitted jerseys, pullovers & cardigans
                                                                                                                              2640 (1%) Raw
                                                                                                                              processed jute
                                                                                                                              and other fibres


                                                                                            8510 (1.2%) 8463  8434  6581  8465
                                                               8441 (6.3%) Men's undershirt  Footwear
                                                                                                                              6582


                                                                                                           8431
                                                                                            8484    8452                      5621
                                                                                            (0.76%)  (0.72%)


                  * Numbers indicate SITC-4 rev 2 codes. Parenthesis indicate percentage of total exports. Treemap Headers show: Total Trade/Total World Trade (share of world trade represented by the country).
   107   108   109   110   111   112   113   114   115   116   117