
Page 114 - The Atlas of Economic Complexity
P. 114
MAPPING PATHS TO PROSPERITY | 115
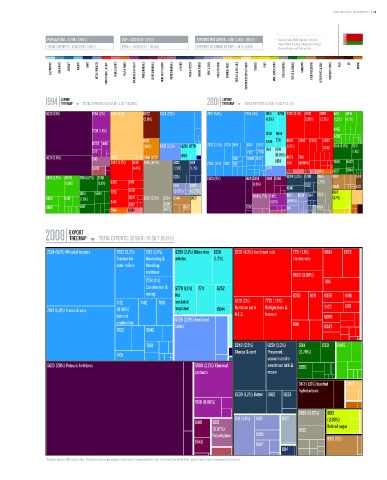
POPULATION ≥ 9.7 M / (74/10) GDP ≥ USD 61 b / (65/11) EXPORTS PER CAPITA ≥ USD 3,409 / (46/11) * Data are from 2008. Numbers indicate:
value (World Ranking / Regional Ranking).
TOTAL EXPORTS ≥ USD 33 b / (58/11) GDPpc ≥ USD 6,277 / (61/16) EXPORTS AS SHARE OF GDP ≥ 54 % (24/6) Eastern Europe and Central Asia.
ELECTRONICS MACHINERY AIRCRAFT bOILERS SHIPS METAL PRODUCTS CONSTR. MATL. & EqPT. HOME & OFFICE PULP & PAPER CHEMICALS & HEALTH AGROCHEMICALS OTHER CHEMICALS INOR. SALTS & ACIDS PETROCHEMICALS LEATHER MILK & CHEESE ANIMAL FIbERS MEAT & EGGS FISH & SEAFOOD TROPICAL AGRIC. CEREALS & vEG. OILS COTTON/RICE/SOY & OTHERS TObACCO FRUIT MISC. AGRICULTURE NOT CLASSIFIED TEXTILE & FAbRICS GARMENTS FOOD PROCESSING bEER/SPIRITS & CIGS. PRECIOUS STONES COAL OIL MINING
EXPORT EXPORT
1994 TREEMAP TOTAL EXPORTS: 942.42 M / 4.30 T (0.02%) 2001 TREEMAP TOTAL EXPORTS: 6.25 b / 5.90 T (0.11%)
Total Exports: 942.42 M / 4.30 T (0.02%) Total Exports: 6.25 B / 5.90 T (0.11%)
5623 (13%) 5156 (2%) 6841 (9.1%) 6672 7224 (7.2%) 7821 (7.4%) 7224 (4%) 6931 6259 7752 (3.1%) 6732 8219 8431 8510
(2.8%) (1.5%) (2.6%) (2.3%) (1.2%) (1.1%)
5138 (1.5%) 8465
6252 6644
8459
6821 6770 7711 6624 2482 6353 6633
8720 5148
(1.8%) 6725 (2.2%) 6259 6770 7832 (2.1%) 7234 7491 6251 6572 (1.3%) 6342 6514 (1.8%) 6531
5112 7162 7758 7611 8710 (1.1%)
5621 (5.8%) 5831 2882 2890 5225 6931 7831 6940 7422 (0.85%) 6973 7861
2482 (2.7%) 8219 2665 (6.7%) 5922 6114 7783 7212 7132 7361 8124 (1%) (0.98%) 2666 6522
5629 (1.4%) (1.5%) (1.1%) 6725 6544
7852 6652 6415 6517
8431 (2.5%) 8439 6514 (1.7%) 2666 0224 5623 (9%) 5621 5334 6419 6546 0224 (1.3%) 0230 2665 8931 1124
(1.9%) (1.3%) 6342 2471 (1.5%) (1.7%)
0011 0372 0240 5922 0620 1123
2651 6544 7752 6732 (0.97%) (0.77%) 0113 0251 6114 5823 0612
8429 8421 (1.3%) 6618 5823 (2.2%) 3224 0546 2631 5831 (1.7%) 5156 (1.7%)
6416 2820 (1.2%) (0.95%)
8465 6517 6351 0579 3352 0111 6651
5981 6643 2672
EXPORT
2008 TREEMAP TOTAL EXPORTS: 32.96 b / 15.56 T (0.21%)
Total Exports: 32.96 B / 15.56 T (0.21%)
7224 (6.1%) Wheeled tractors 7832 (2.2%) 7212 (1.3%) 6259 (2.1%) Other tires 6931 6732 (4.3%) Iron/steel rods 7731 (1.1%) 6624 6973
Tractors for Harvesting & articles (1.2%) Electric wire
semi-trailers threshing
machines
6633 (0.99%)
7234 (1%) 7861
Construction & 6770 (1.1%) 7711 6252
mining Not 6353 8211 6359 6416
7132 7442 machinery 7831 insulated 8219 (2%) 7752 (1.9%) 2471
7821 (5.8%) Trucks & vans (0.98%) iron/steel 6644 Furniture parts Refrigerators & 2472
Internal wire N.E.S. freezers 6996
combustion 6725 (2.9%) Iron/steel 6911
billets
engines for 6940 6343
7822
motor
vehicles
7188 0240 (2.5%) 0224 (2.3%) 6514 6531 8465
Cheese & curd Preserved, (0.78%)
7431
concentrated or
5623 (20%) Potassic fertilizers 5989 (2.2%) Chemical sweetened milk & 2666
products cream
3413 (1.6%) liquified 2783
hydrocarbons
0230 (1.2%) Butter 5922 0223
5156 (0.86%)
2665 (0.73%) 0612
0111 (1.4%) 0113 0371 (0.96%)
6419 5831
(0.97%) 5823 Refined sugar
Polyethylene 0149
6546 8931 (1%)
0142
6114
* Numbers indicate SITC-4 rev 2 codes. Parenthesis indicate percentage of total exports. Treemap Headers show: Total Trade/Total World Trade (share of world trade represented by the country).