
Page 116 - The Atlas of Economic Complexity
P. 116
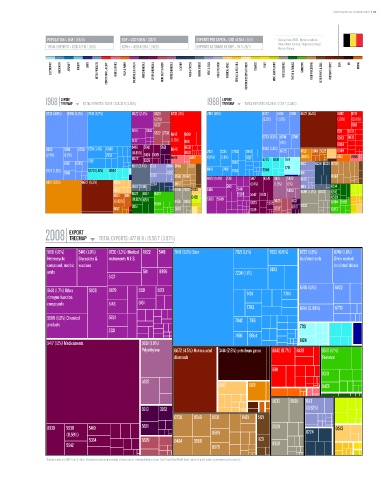
MAPPING PATHS TO PROSPERITY  |  117


                   POPULATION ≥ 11 M / (66/8)  GDP ≥ USD 505 b / (20/7)   EXPORTS PER CAPITA ≥ USD 44,544 / (4/1)  *   Data are from 2008 . Numbers indicate:
                                                                                                          value (World Ranking / Regional Ranking).
                   TOTAL EXPORTS ≥ USD 477 b / (8/5)  GDPpc ≥ USD 47,194 / (14/9)  EXPORTS AS SHARE OF GDP ≥ 94 % (6/1)    Western Europe.

                    ELECTRONICS  MACHINERY  AIRCRAFT   bOILERS   SHIPS   METAL PRODUCTS  CONSTR. MATL. & EqPT.  HOME & OFFICE  PULP & PAPER  CHEMICALS & HEALTH  AGROCHEMICALS  OTHER CHEMICALS  INOR. SALTS & ACIDS  PETROCHEMICALS  LEATHER  MILK & CHEESE  ANIMAL FIbERS  MEAT & EGGS  FISH & SEAFOOD  TROPICAL AGRIC.  CEREALS & vEG. OILS  COTTON/RICE/SOY & OTHERS  TObACCO  FRUIT  MISC. AGRICULTURE  NOT CLASSIFIED  TEXTILE & FAbRICS  GARMENTS  FOOD PROCESSING  bEER/SPIRITS & CIGS.  PRECIOUS STONES  COAL  OIL  MINING


                        EXPORT                                                      EXPORT
                  1968 TREEMAP  TOTAL EXPORTS: 7.88 b / 228.33 b (3.45%)      1988 TREEMAP  TOTAL EXPORTS: 93.29 b / 2.79 T (3.34%)
                                         Total Exports: 7.88 B / 228.33 B (3.45%)                    Total Exports: 93.29 B / 2.79 T (3.34%)
                  6733 (4.9%)  6746 (4.6%)  7810 (9.7%)  8822 (2.4%)  5629  6732 (4%)  7810 (13%)  6727  6746  6749 6672 (8.4%)  6842  8219
                                                          (1.2%)                                   (2.2%)  (1.9%)              (1.6%)  (0.81%)
                                                          5232                                                                      6911
                                                  5155  3345                                                                   8211  3510
                                                          5622 2733  6842  6618
                                                  5137           (1.3%)  6911                      6733 (1.3%) 6744  6745      6343 6633
                                                                                                         (1%)
                                                                                                                               6924
                  6822   6749  6725 6731 (1.4%) 8946  6419  5542  5621  6649  6633  7821  7234  7783  7842  6822 (1.2%)  6725  6821  6861 5225  6649
                  (2.4%)  (1.2%)         7831     (0.85%)  6424 0819  6643  6924 6412  (1.5%)  (1.3%)  8121      (0.9%)        6412  8960
                                  7212            8922  5335                                       6770 6931  7611
                         6747  6783                                                    7449                      0113  0224 0230 0730
                                                  6512 (2.4%) 0113  0114 0545  0730                        7781
                  6727 (1.3%)     6770 (1.6%)  6644                           6418  7431  7493     6644
                         6745                                  6130                                              0111
                                                         0013     0565 0484   8822 (1.4%) 2331  5417  8939 5831  5832       0484
                  6821 (7.5%)  6672 (6.3%)  6998         0224     0980                        (1.4%)   (1.8%)  (1%)  0149
                                                  2682 2686                          5113                        0011       6514
                                           6851                   6935 2820 2926  5156   5148               5834  6595 (1.6%) 5823  6516
                                           6861  6811  6522  6517  8472  0482            5824  5542 8921                    6539
                                           (0.93%)  (0.92%) 6519  6584  6651 6932  5839 5989  6573  5335 5629  5621         6594 6596
                                                  2651                                                        5913  5833
                                           6612                   2665                        0819     5232                 8423


                           EXPORT
                  2008 TREEMAP        TOTAL EXPORTS: 477.19 b / 15.56 T (3.07%)
                                                                Total Exports: 477.19 B / 15.56 T (3.07%)
                   5156 (1.8%)  5416 (1.8%)  8720 (1.3%) Medical 8822  5145  7810 (9.1%) Cars  7821 (1.1%)  7832 (0.8%)  6727 (1.8%)  6749 (1.6%)
                   Heterocyclic  Glycosides &  instruments N.E.S.                                                Iron/steel coils  Other worked
                   compound; nucleic vaccines                                                                                iron/steel sheets
                   acids                              5111  8996                         7234 (1.1%)  7493
                                         5137
                                                                                                                 6746 (1.1%)  6822
                   5148 (1.7%) Other  5839  5829     5331   5123                             7431          7784
                   nitrogen-function
                   compounds             5146        5161
                                                                                             7783                6744 (0.98%)  6733
                   5989 (1.6%) Chemical  5824                                            7842  7851
                   products                                                                                      7781
                                         2331
                                                                                         7436  6954
                                                                                                                 8124
                   5417 (12%) Medicaments             5831 (1.9%)
                                                      Polyethylene  6672 (4.5%) Not mounted  3414 (2.6%) petroleum gases  6842 (0.7%)  6428  8510 (1.1%)
                                                                  diamonds                                               Footwear

                                                                                                      6911
                                                                                                                         8310
                                                      5832
                                                                                   6812       6821                       8423

                                                                                                      5833   6595  0113
                                                      5913  3352                                                   (0.52%)
                                                                  0730   0546   8931       6421  5121

                   8939   5530    5419                5621                                            2820                    0573
                          (0.59%)                                               0585                               0224
                                  5334                5629        0484   0980                    1123
                          5542                                                  0579                  8928

                  * Numbers indicate SITC-4 rev 2 codes. Parenthesis indicate percentage of total exports. Treemap Headers show: Total Trade/Total World Trade (share of world trade represented by the country).