Page 120 - The Atlas of Economic Complexity
P. 120

MAPPING PATHS TO PROSPERITY  |  121


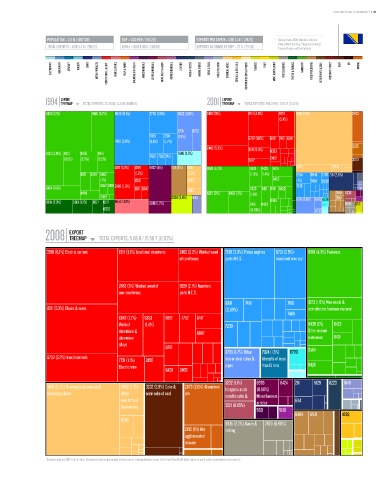
                   POPULATION ≥ 3.8 M / (107/20)  GDP ≥ USD 19 b / (96/20)  EXPORTS PER CAPITA ≥ USD 1,341 / (74/21)  *   Data are from 2008. Numbers indicate:
                                                                                                          value (World Ranking / Regional Ranking).
                   TOTAL EXPORTS ≥ USD 5.1 b / (95/21)  GDPpc ≥ USD 4,906 / (68/18)  EXPORTS AS SHARE OF GDP ≥ 27 % (73/18)    Eastern Europe and Central Asia.

                    ELECTRONICS  MACHINERY  AIRCRAFT   bOILERS   SHIPS   METAL PRODUCTS  CONSTR. MATL. & EqPT.  HOME & OFFICE  PULP & PAPER  CHEMICALS & HEALTH  AGROCHEMICALS  OTHER CHEMICALS  INOR. SALTS & ACIDS  PETROCHEMICALS  LEATHER  MILK & CHEESE  ANIMAL FIbERS  MEAT & EGGS  FISH & SEAFOOD  TROPICAL AGRIC.  CEREALS & vEG. OILS  COTTON/RICE/SOY & OTHERS  TObACCO  FRUIT  MISC. AGRICULTURE  NOT CLASSIFIED  TEXTILE & FAbRICS  GARMENTS  FOOD PROCESSING  bEER/SPIRITS & CIGS.  PRECIOUS STONES  COAL  OIL  MINING


                        EXPORT                                                      EXPORT
                  1994 TREEMAP  TOTAL EXPORTS: 22.38 M / 4.30 b (0.001%)      2001 TREEMAP  TOTAL EXPORTS: 915.09 M / 5.90 T (0.02%)
                                         Total Exports: 22.38 M / 4.30 T (0.001%)                    Total Exports: 915.09 M / 5.90 T (0.02%)
                  8439 (12%)       8510 (5.7%)  8946 (6.1%)  7783 (3.9%)  6822 (2.6%)  2483 (9%)  8211 (4.8%)  8219  6841 (19%)     2873
                                                                                                         (2.4%)

                                                                   6716  6733
                                                         7493  7284  (2.1%)
                                            7436 (5.8%)  (1.8%)  (1.7%)                       6732 (1.6%)  6911 2471 6341
                                                                              2482 (5.3%)     3510 (1.5%)                           5225
                  6123 (3.9%) 8431  8435  8441           7428 7832 7416  7643 (1.7%)                  6353
                         (3.6%)  (2.3%)  (2.2%)                                               2472    2450                          3223
                                            8211 (2.3%)  8219  8922 (5%)  1121 (3%) 6841  8510 (6.7%)  8424  8429  8431  2882  2783
                               8451 8424 8462      (1.2%)              (1.2%)                 (1.5%) (1.4%)    6954  8946 7783 2111 (2.8%)
                                      (1%)         6341                2783                            8462    (1%)  7499  6940
                  8434 (3.1%)         8452 8481 2483 (1.9%)  6911 6842  2882                  8423  8421 8451 8422  7436
                               8459                                           6123 (3%)  8439 (3%)  (1.1%)                    0484 5232
                                      6589                       2924 (2.4%)  0118                                            0561
                  6516 (2.3%)  6513 (1.7%)  6521  6517  6652 (3.1%)  0819 (1.7%)              8481  8459  8465  6716 (1.9%) 6783 6770  6935 1212
                                        6536                                                  (0.83%)                 6733


                           EXPORT
                  2008 TREEMAP        TOTAL EXPORTS: 5.06 b / 15.56 T (0.03%)
                                                                 Total Exports: 5.06 B / 15.56 T (0.03%)
                   3510 (6.1%) Electric current  6911 (3.1%) Iron/steel structures  2482 (2.2%) Worked wood  7139 (3.9%) Piston engines  6731 (2.5%)  8510 (4.3%) Footwear
                                                                    of coniferous    parts N.E.S.       Iron/steel wire rod


                                             2483 (3%) Worked wood of  8219 (2.1%) Furniture
                                             non-coniferous         parts N.E.S.

                                                                                     6991   7491            7169    6123 (1.9%) Non-metal &
                   8211 (5.3%) Chairs & seats                                        (0.69%)                        non-abestos footwear material
                                                                                                            7449
                                             6842 (1.7%)  6353  6912  7752  6417
                                             Worked    (1.4%)                        7239                           8439 (1%)  8423
                                             aluminium &                  6997                                      Other women
                                             aluminium                                                              outerwear  8431
                                             alloys
                                                               8212
                                                                                     6783 (1.7%) Other  7924 (1.3%)  6770  6584
                   6732 (3.2%) Iron/steel rods                                       iron or steel tubes &  Aircrafts of more
                                             7731 (1.1%)  2450
                                             Electric wire                           pipes        than 15 tons      8424
                                                               6428  2460
                                                                                     5232 (1.1%)  8939   6424  2111   6129  0223  0149
                   6841 (8.2%) Unwrought aluminium &  2882 (1.2%)  3232 (3.9%) Coke &  2873 (2.6%) Aluminium  Inorganic acids  (0.98%)
                   aluminium alloys           Other    semi-coke of coal  ore        metallic salts &  Miscellaneous
                                              non-ferrous                            peroxysalts  articles     6114
                                              base metals                            5221 (0.85%)
                                                                                                 of 5621  5138
                                                                                                 plastic       0484  8931       4236
                                              6794
                                                                                     6935 (2.2%) Gauze &  2820 (0.98%)
                                                                      2815 (1%) Not  netting
                                                                      agglomerated
                                                                      iron ore


                  * Numbers indicate SITC-4 rev 2 codes. Parenthesis indicate percentage of total exports. Treemap Headers show: Total Trade/Total World Trade (share of world trade represented by the country).
   115   116   117   118   119   120   121   122   123   124   125