Page 152 - The Atlas of Economic Complexity
P. 152

MAPPING PATHS TO PROSPERITY  |  153


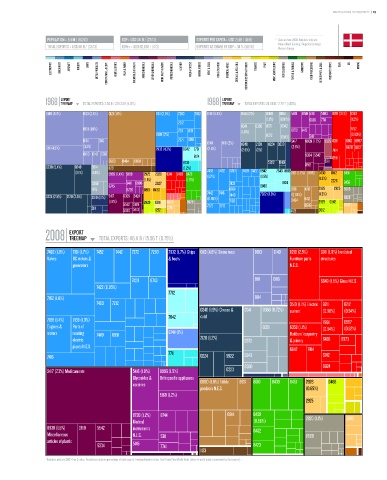
                   POPULATION ≥ 5.5 M / (92/13)  GDP ≥ USD 341 b / (27/13)  EXPORTS PER CAPITA ≥ USD 21,115 / (11/6)  *   Data are from 2008. Numbers indicate:
                                                                                                          value (World Ranking / Regional Ranking).
                   TOTAL EXPORTS ≥ USD 116 b / (33/13)  GDPpc ≥ USD 62,036 / (4/3)  EXPORTS AS SHARE OF GDP ≥ 34 % (58/10)    Western Europe.

                    ELECTRONICS  MACHINERY  AIRCRAFT   bOILERS   SHIPS   METAL PRODUCTS  CONSTR. MATL. & EqPT.  HOME & OFFICE  PULP & PAPER  CHEMICALS & HEALTH  AGROCHEMICALS  OTHER CHEMICALS  INOR. SALTS & ACIDS  PETROCHEMICALS  LEATHER  MILK & CHEESE  ANIMAL FIbERS  MEAT & EGGS  FISH & SEAFOOD  TROPICAL AGRIC.  CEREALS & vEG. OILS  COTTON/RICE/SOY & OTHERS  TObACCO  FRUIT  MISC. AGRICULTURE  NOT CLASSIFIED  TEXTILE & FAbRICS  GARMENTS  FOOD PROCESSING  bEER/SPIRITS & CIGS.  PRECIOUS STONES  COAL  OIL  MINING


                        EXPORT                                                      EXPORT
                  1968 TREEMAP  TOTAL EXPORTS: 2.56 b / 228.33 b (1.12%)      1988 TREEMAP  TOTAL EXPORTS: 28.69 b / 2.79 T (1.03%)
                                         Total Exports: 2.56 B / 228.33 B (1.12%)                    Total Exports: 28.69 B / 2.79 T (1.03%)
                  0149 (8.1%)   0113 (2.4%)  0121 (14%)    7411 (2.9%)  7283  7452  0113 (6.3%)  0344 (2%)  0360  0814  5169  8748 5311  5983  8219 (3.1%) 6353
                                                                                                    (1.1%)  (0.91%)  5839  7741    (1.2%)
                                                                   7212
                                0011 (1.9%)                        7211  8121              0341  0350 0371  0342  8720 5415        7752
                                                                                           (1.6%)
                                                           7499 (2%)                                0372  0343      5411           (0.93%)
                                0114  0116                         7271  6991  0149  0111 (2%)               5417  8939 (1.7%) 5629 8211  6912 6997
                  0111 (4.5%)   (1.3%)                     7932 (4.3%)  8942 7781  (2.6%)  0240  2120  0224 0230  (2.8%)     7414  6428 8212
                                                                                           (2.5%)
                                                                                                (2%)
                                0013 0142 0913                                                                     5334 5542
                                                                         8124                                                6911
                                         0980  0484  0620            8731                            5922  0451           5911
                  0230 (5.4%)  0240  0814  1123                      (1.2%)                                        8921
                             (3.1%)  (1.8%)  5989 (1.4%) 5169  2925  2926  6341 2483 8472  7492  7452 7283  7429 7422 8942  7643 8813  0121 (1.7%) 0980 0430  0412  8451
                                                       (1.1%)         (1.9%)  (1.7%)              (1.5%)                (1.2%)  2226
                                   0350  8745   5411 8996  2927                       7431        8983    8124                   8459
                                   (1%)         8720   0813 0430                      6991                   8931  4312  2926  2925 6595
                  0224 (2.5%)  2120 (2.5%)  2919 (1.1%)  5417  5335 6424      7442  7416  7449    7932 (3.3%)  (0.94%)  6421  (1.3%)  8928
                                                                              (0.95%)
                                         (1.9%)        2929  0811  6998  8928         7188                   0484       2929 0542
                                               5542 0819                      7272  7212                          0546           2882
                                   2111            5413        2785
                                               5530        1222                                              1123       0612

                           EXPORT
                  2008 TREEMAP        TOTAL EXPORTS: 116.11 b / 15.56 T (0.75%)
                                                                 Total Exports: 116.11 B / 15.56 T (0.75%)
                   7492 (1.8%)  7161 (1.7%)  7452  7442  7272  7283  7932 (1.7%) Ships 0113 (4.8%) Swine meat  0013  0149  8219 (2.5%)  6911 (1.9%) Iron/steel
                   Valves   DC motors &                         & boats                                      Furniture parts  structures
                            generators                                                                       N.E.S.

                                                  7429   8743                                   0111   0116             6649 (1.5%) Glass N.E.S.
                                     7422 (0.85%)
                                                                7712
                   7162 (1.6%)                                                                  0114
                                     7493  7212                                                              3510 (1.1%) Electric 8211  8212
                                                                            0240 (1.9%) Cheese &  0341  0360 (0.72%)  current  (0.58%)  (0.54%)
                                                                7642        curd
                   7188 (1.4%)  7169 (1.3%)                                                                              7861    6997
                   Engines &  Parts of                                                             0371      6353 (1.1%)  (0.54%)  (0.52%)
                   motors   rotating  7449  6991                6744 (1%)                                    Builders` carpentry
                            electric                                        2120 (1.2%)     0372             & joinery   6428   6973
                            plants N.E.S.                                                                    6842   7414
                                                                7711
                   7416                                                     0224     5922   0343                         6912
                                                                                            0350                         6924
                   5417 (7.3%) Medicaments        5416 (1.8%)  8996 (1.5%)           0223
                                                  Glycosides &  Orthopaedic appliances
                                                  vaccines                  0980 (1.9%) Edible  8931  8510  8439  8451  2926  0488
                                                                            products N.E.S.                        (0.65%)
                                                             5169 (1.2%)
                                                                                                                   2925


                                                  8720 (1.2%)  8744                   0914     8459                2820 (1.1%)    2882
                                                  Medical                                      (0.56%)
                   8939 (1.5%)  0819  5542        instruments                                  8462
                   Miscellaneous                  N.E.S.     5311                                                  8928
                   articles of plastic
                                     5334         5145       7741                              8423
                                                                            1123
                  * Numbers indicate SITC-4 rev 2 codes. Parenthesis indicate percentage of total exports. Treemap Headers show: Total Trade/Total World Trade (share of world trade represented by the country).
   147   148   149   150   151   152   153   154   155   156   157