
Page 154 - The Atlas of Economic Complexity
P. 154
MAPPING PATHS TO PROSPERITY | 155
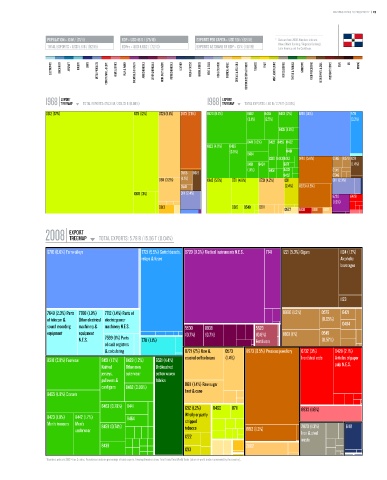
POPULATION ≥ 10 M / (71/11) GDP ≥ USD 46 b / (75/10) EXPORTS PER CAPITA ≥ USD 581 / (92/18) * Data are from 2008. Numbers indicate:
value (World Ranking / Regional Ranking).
TOTAL EXPORTS ≥ USD 5.8 b / (92/15) GDPpc ≥ USD 4,602 / (72/13) EXPORTS AS SHARE OF GDP ≥ 13 % (118/19) Latin America and the Caribbean.
ELECTRONICS MACHINERY AIRCRAFT bOILERS SHIPS METAL PRODUCTS CONSTR. MATL. & EqPT. HOME & OFFICE PULP & PAPER CHEMICALS & HEALTH AGROCHEMICALS OTHER CHEMICALS INOR. SALTS & ACIDS PETROCHEMICALS LEATHER MILK & CHEESE ANIMAL FIbERS MEAT & EGGS FISH & SEAFOOD TROPICAL AGRIC. CEREALS & vEG. OILS COTTON/RICE/SOY & OTHERS TObACCO FRUIT MISC. AGRICULTURE NOT CLASSIFIED TEXTILE & FAbRICS GARMENTS FOOD PROCESSING bEER/SPIRITS & CIGS. PRECIOUS STONES COAL OIL MINING
EXPORT EXPORT
1968 TREEMAP TOTAL EXPORTS: 176.31 M / 228.33 b (0.08%) 1988 TREEMAP TOTAL EXPORTS: 1.80 b / 2.79 T (0.06%)
Total Exports: 176.31 M / 228.33 B (0.08%) Total Exports: 1.80 B / 2.79 T (0.06%)
0612 (57%) 0711 (12%) 0721 (9.1%) 2873 (7.5%) 8423 (8.2%) 8462 8465 8463 (2%) 6716 (14%) 7721
(3.1%) (2.5%) (3.3%)
8435 (1.6%)
8441 (1.6%) 8422 8459 8432
6123 (4.8%) 8439
(3.8%) 8481
8434
8310 8443 8442 9710 (5.8%) 0565 0579 1221
8431 8424 8471 (1.4%)
(1.1%) 8451 8433 0545
0565 0619 8452 0546
0611 (3.2%) (1.1%) 0612 (5.5%) 0711 (4.6%) 0721 (4.2%) 1211 0111 (2.3%)
0545 (2.4%) 8973 (4.8%)
0615 (3%) 0111 (2.4%)
8720 6428
(1.9%)
0813 0615 0548 0611
0577 6831 6811 6812
EXPORT
2008 TREEMAP TOTAL EXPORTS: 5.78 b / 15.56 T (0.04%)
Total Exports: 5.78 B / 15.56 T (0.04%)
6716 (8.6%) Ferro-alloys 7721 (5.5%) Switchboards, 8720 (9.3%) Medical instruments N.E.S. 7741 1221 (5.3%) Cigars 1124 (1.7%)
relays & fuses Alcoholic
beverages
1123
7649 (2.3%) Parts 7788 (1.9%) 7712 (1.4%) Parts of 0980 (1.3%) 0579 6421
of telecom & Other electrical electric power (0.65%)
sound recording machinery & machinery N.E.S. 5530 8939 5629 0484
equipment equipment (0.7%) (0.7%) (0.8%) 8931 (1%) 0545
N.E.S. 7599 (1%) Parts 7711 (1.1%) Fertilizers (0.57%)
of cash registers
& calculating 0721 (2%) Raw & 0573 8973 (6.5%) Precious jewellery 6732 (3%) 6428 (2.1%)
machines roasted coffee beans (1.4%) Iron/steel rods Articles of paper
8510 (2.8%) Footwear 8451 (1.7%) 8429 (1.2%) 6521 (4.4%)
Knitted Other men Unbleached pulp N.E.S.
jerseys, outerwear cotton woven
pullovers & fabrics
cardigans 8462 (0.86%) 0611 (1.4%) Raw sugar
8465 (1.9%) Corsets beet & cane
8463 (0.79%) 8441 1212 (1.2%) 0460 0711 8933 (1.6%)
8423 (1.8%) 8442 (1.7%) 8464 Wholly or partly
Men's trousers Men's 8459 (0.74%) stripped 2820 (1.3%) 6118
underwear tobacco 6612 (1.3%) Iron & steel
1222
waste
8439 2882
1213
* Numbers indicate SITC-4 rev 2 codes. Parenthesis indicate percentage of total exports. Treemap Headers show: Total Trade/Total World Trade (share of world trade represented by the country).