Page 158 - The Atlas of Economic Complexity
P. 158

MAPPING PATHS TO PROSPERITY  |  159


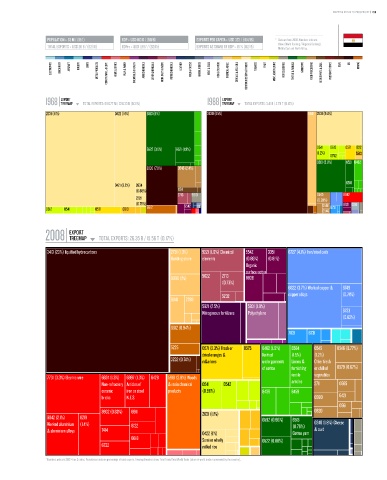
                   POPULATION ≥ 82 M / (15/1)  GDP ≥ USD 163 b / (50/6)   EXPORTS PER CAPITA ≥ USD 323 / (104/16)  *   Data are from 2008. Numbers indicate:
                                                                                                          value (World Ranking / Regional Ranking).
                   TOTAL EXPORTS ≥ USD 26 b / (62/10)  GDPpc ≥ USD 1,997 / (92/15)  EXPORTS AS SHARE OF GDP ≥ 16 % (112/15)    Middle East and North Africa.

                    ELECTRONICS  MACHINERY  AIRCRAFT   bOILERS   SHIPS   METAL PRODUCTS  CONSTR. MATL. & EqPT.  HOME & OFFICE  PULP & PAPER  CHEMICALS & HEALTH  AGROCHEMICALS  OTHER CHEMICALS  INOR. SALTS & ACIDS  PETROCHEMICALS  LEATHER  MILK & CHEESE  ANIMAL FIbERS  MEAT & EGGS  FISH & SEAFOOD  TROPICAL AGRIC.  CEREALS & vEG. OILS  COTTON/RICE/SOY & OTHERS  TObACCO  FRUIT  MISC. AGRICULTURE  NOT CLASSIFIED  TEXTILE & FAbRICS  GARMENTS  FOOD PROCESSING  bEER/SPIRITS & CIGS.  PRECIOUS STONES  COAL  OIL  MINING


                        EXPORT                                                      EXPORT
                  1968 TREEMAP  TOTAL EXPORTS: 696.77 M / 228.33 b (0.31%)    1988 TREEMAP  TOTAL EXPORTS: 3.41 b / 2.79 T (0.12%)
                                        Total Exports: 696.77 M / 228.33 B (0.31%)                   Total Exports: 3.41 B / 2.79 T (0.12%)
                  2631 (41%)                0422 (14%)  6513 (11%)            3330 (65%)                            6841 2631 (9.4%)


                                                        6522 (3.5%)  6521 (1.9%)                                       0541  0615  0571 1222
                                                                                                                       (1.2%)        5513
                                                                                                                            0752
                                                                                                                       6513 (5.9%)  6521 8462
                                                        3330 (7.6%)  0545 (2.4%)


                                                                                                                                  6516
                                            0421 (3.2%)  2634
                                                    (0.88%)        1124
                                                                   2713  9610                                          0545      6842
                                                    2221                                                               (0.93%)
                                                    (0.75%)                                                              0561    8921 0341
                  0612   0541        0571      0813     6612          5542                                               0546  6731


                           EXPORT
                  2008 TREEMAP        TOTAL EXPORTS: 26.35 b / 15.56 T (0.17%)
                                                                 Total Exports: 26.35 B / 15.56 T (0.17%)
                   3413 (23%) liquified hydrocarbons             2731 (1.3%)  5221 (1.6%) Chemical  5542  3351  6727 (4.1%) Iron/steel coils
                                                                 Building stone  elements    (0.86%)  (0.81%)
                                                                                             Organic
                                                                                             surface-active
                                                                 6998 (1%)  5622    2713     8939
                                                                                             agents
                                                                                    (0.73%)
                                                                                             N.E.S.         6822 (3.7%) Worked copper &  6749
                                                                                    5232                    copper alloys        (0.74%)
                                                                 6841  2789
                                                                            5621 (2.5%)      5831 (1.8%)
                                                                            Nitrogenous fertilizers  Polyethylene                6733
                                                                                                                                 (0.63%)

                                                                 6612 (0.94%)
                                                                                                            7831    6731

                                                                 5225       0571 (2.3%) Fresh or  0575  8462 (1.9%)  6584  0545  0546 (0.77%)
                                                                            dried oranges &        Knitted    (1.5%)  (1.2%)
                                                                 3232 (0.74%)  m&arines            undergarments  Linens &  Other fresh
                                                                                                   of cotton  furnishing  or chilled  0579 (0.67%)
                                                                                                              textile  vegetables
                   7731 (3.3%) Electric wire  6624 (1.3%)  6997 (1.3%)  6428  5981 (3.9%) Woods
                                       Non-refractory Articles of  & resin chemical  0541  0542               articles  2711   0585
                                       ceramic  iron or steel   products    (0.96%)                8439      8459
                                       bricks   N.E.S.                                                                0980     6421
                                                                                                                               0561
                                       8932 (0.83%)  6911                   2631 (1.1%)                               0620
                   6842 (2.1%)  8219                                                               6592 (0.96%)  6513
                   Worked aluminium  (1.4%)       8122                                                        (0.78%)  0240 (1.8%) Cheese
                   & aluminium alloys  7414                                 0422 (1%)                         Cotton yarn  & curd
                                                  6618                      Semi or wholly         6522 (0.88%)
                                       6732                                 milled rice

                  * Numbers indicate SITC-4 rev 2 codes. Parenthesis indicate percentage of total exports. Treemap Headers show: Total Trade/Total World Trade (share of world trade represented by the country).
   153   154   155   156   157   158   159   160   161   162   163