
Page 186 - The Atlas of Economic Complexity
P. 186
MAPPING PATHS TO PROSPERITY | 187
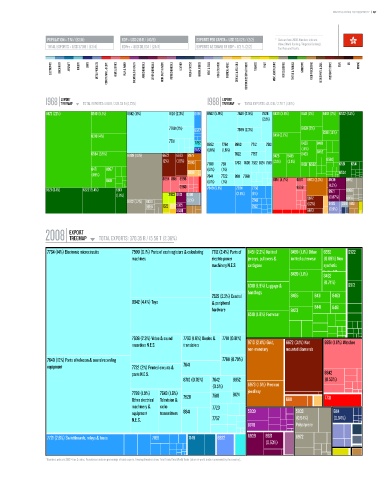
POPULATION ≥ 7 M / (83/11) GDP ≥ USD 215 b / (40/8) EXPORTS PER CAPITA ≥ USD 53,026 / (2/2) * Data are from 2008. Numbers indicate:
value (World Ranking / Regional Ranking).
TOTAL EXPORTS ≥ USD 370 b / (13/4) GDPpc ≥ USD 30,834 / (24/4) EXPORTS AS SHARE OF GDP ≥ 172 % (2/2) East Asia and Pacific.
ELECTRONICS MACHINERY AIRCRAFT bOILERS SHIPS METAL PRODUCTS CONSTR. MATL. & EqPT. HOME & OFFICE PULP & PAPER CHEMICALS & HEALTH AGROCHEMICALS OTHER CHEMICALS INOR. SALTS & ACIDS PETROCHEMICALS LEATHER MILK & CHEESE ANIMAL FIbERS MEAT & EGGS FISH & SEAFOOD TROPICAL AGRIC. CEREALS & vEG. OILS COTTON/RICE/SOY & OTHERS TObACCO FRUIT MISC. AGRICULTURE NOT CLASSIFIED TEXTILE & FAbRICS GARMENTS FOOD PROCESSING bEER/SPIRITS & CIGS. PRECIOUS STONES COAL OIL MINING
EXPORT EXPORT
1968 TREEMAP TOTAL EXPORTS: 1.68 b / 228.33 b (0,73%) 1988 TREEMAP TOTAL EXPORTS: 42.13 b / 2.79 T (1.51%)
Total Exports: 1.68 B / 228.33 B (0.73%) Total Exports: 42.13 B / 2.79 T (1.51%)
8472 (22%) 8510 (5.1%) 8942 (11%) 8124 (2.3%) 6991 8942 (5.9%) 7649 (2.5%) 7628 8439 (3.8%) 8441 (2%) 8462 (2%) 6522 (7.4%)
(2.1%)
7788 (2%) 8459 (2%)
6577 7599 (2.3%) 8310 (1.1%)
8310 (4%) 8451 (3.7%)
7781 7782 8852 7764 8983 7712 7512 8429 8481
5852 (1.8%) (1.6%) (1.1%)
6584 (3.5%) 8999 (10%) 6672 6673 8973 7622 7757 8423 8435 8463 8452
(2%) (1.6%) 2890 7788 7611 7763 7638 7522 8124 7518 (2.1%) (2.1%) 8431 6552 6560 6531 6541
8471 8997 (1.1%) (1%)
(1.9%) 6998 7641 7722 8811 7768 6534
8481 8994 8851 8998 (1.1%) (1%) 8851 (4.7%) 6974 8973 (2.3%) 8939 8972
6960 7849 (5.1%) 7284 7758 8998 (1.3%)
6521 (6.1%) 6522 (5.4%) 6513 8921 8999
(1.8%) 2923 8921 0360 (2.8%) (1%) 6672 (0.87%) 8928
8972 (1.7%) 8830 (1.1%) 7243 (1.2%) 8483 0341 8931
6658 1222 5335 7162
5530 6673 (0.9%)
EXPORT
2008 TREEMAP TOTAL EXPORTS: 370.35 b / 15.56 T (2.38%)
Total Exports: 370.35 B / 15.56 T (2.38%)
7764 (14%) Electronic microcircuits 7599 (6.1%) Parts of cash registers & calculating 7712 (2.4%) Parts of 8451 (2.2%) Knitted 8459 (1.1%) Other 6552 6522
machines electric power jerseys, pullovers & knitted outerwear (0.89%) Non
machinery N.E.S. cardigans synthetic
8439 (1.1%) knitted fibres
8462
(0.74%)
8310 (1.9%) Luggage & 6513
handbags
7525 (2.3%) Control 8465 8431 8463
8942 (4.4%) Toys & peripheral
hardware 8423 8441 8481
8510 (1.8%) Footwear
7638 (2.3%) Video & sound 7763 (1.6%) Diodes & 7781 (0.81%)
recorders N.E.S. transistors 9710 (2.4%) Gold, 6672 (3.1%) Not 8851 (1.8%) Watches
non-monetary mounted diamonds
7649 (10%) Parts of telecom & sound recording 7768 (0.79%)
equipment 7722 (2%) Printed circuits & 7641
parts N.E.S. 8842
8710 (0.76%) 7642 8852 (0.53%)
(0.5%) 8973 (1.5%) Precious
7788 (1.9%) 7643 (1.6%) 7518 8124 jewellery
Other electrical Television & 7528 6811 7731
machinery & radio 7723
equipment transmitters 8841 5839 5833 6114
N.E.S. 7757 (0.94%) (0.54%)
8748 Polystyrene
7721 (2.6%) Switchboards, relays & fuses 7169 7149 6822 8939 8921 8972
(0.53%)
* Numbers indicate SITC-4 rev 2 codes. Parenthesis indicate percentage of total exports. Treemap Headers show: Total Trade/Total World Trade (share of world trade represented by the country).