
Page 188 - The Atlas of Economic Complexity
P. 188
MAPPING PATHS TO PROSPERITY | 189
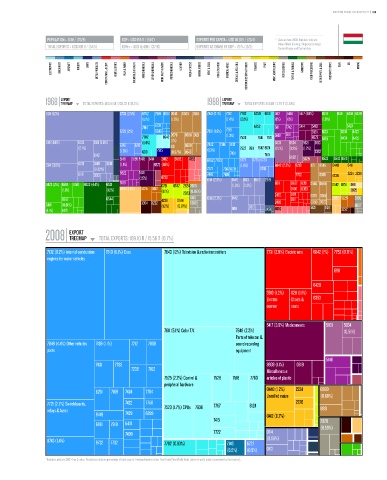
POPULATION ≥ 10 M / (70/9) GDP ≥ USD 155 b / (51/7) EXPORTS PER CAPITA ≥ USD 10,859 / (23/4) * Data are from 2008. Numbers indicate:
value (World Ranking / Regional Ranking).
TOTAL EXPORTS ≥ USD 109 b / (34/5) GDPpc ≥ USD 15,408 / (37/6) EXPORTS AS SHARE OF GDP ≥ 70 % (13/3) Eastern Europe and Central Asia.
ELECTRONICS MACHINERY AIRCRAFT bOILERS SHIPS METAL PRODUCTS CONSTR. MATL. & EqPT. HOME & OFFICE PULP & PAPER CHEMICALS & HEALTH AGROCHEMICALS OTHER CHEMICALS INOR. SALTS & ACIDS PETROCHEMICALS LEATHER MILK & CHEESE ANIMAL FIbERS MEAT & EGGS FISH & SEAFOOD TROPICAL AGRIC. CEREALS & vEG. OILS COTTON/RICE/SOY & OTHERS TObACCO FRUIT MISC. AGRICULTURE NOT CLASSIFIED TEXTILE & FAbRICS GARMENTS FOOD PROCESSING bEER/SPIRITS & CIGS. PRECIOUS STONES COAL OIL MINING
EXPORT EXPORT
1968 TREEMAP TOTAL EXPORTS: 460.81 M / 228.33 b (0,2%) 1988 TREEMAP TOTAL EXPORTS: 6.64 b / 2.79 T (0.24%)
Total Exports: 460.81 M / 228.33 B (0.2%) Total Exports: 6.64 B / 2.79 T (0.24%)
0011 (12%) 6733 (2.5%) 6782 7919 6991 0545 0565 0561 7841 (2.1%) 7212 7782 6259 6931 5112 5156 5417 (1.8%) 8510 8431 8459 8439
(1.1%) (1.5%) (1.4%) (2.1%) (1%) (1%) (1.8%)
6731 6252 5414 5413 8424
7914 5111 7742
6725 (2%) 8946 7831 (1.6%) 7219 5161 3351 6123 8310 8423
7782 8942 0579 0586 0121 (1.3%) 7528 7641 7521 5148 6573 8481 8434 8433
0111 (4.6%) 0012 0113 (1.6%) (1.4%) (1%) 7842 7361 8121 5831 5834 5621 5913
(2.1%) 6746 6712 1121 0589 7522 7611 7642 8124 (2.1%) (1.2%) (1.2%)
(1.3%) 6931 7915 (0.97%) 0546 (1.3%) 3352
0142 7491 7415
5148 5155 5413 5414 2482 6582 7852 6782 7783 6727 6725 6733 5832 5629 6522 6542 6513
0114 (3.9%) 0015 0149 0616 (1.1%) 6573 (1.6%) (1.6%) 6842 (2.3%) 8219 1121 0545 0440 0411
(0.92%) 7272 7367 6731 6744
0118 0013 8822 5621 7449 7169 7752 0565 4236 2224 2238
(1.5%) 6732 0114 (2.9%) 0149 0113 0012 2919
8472 (2%) 6584 8510 6522 (4.4%) 6521 5169 0751 0542 29242665 (1.3%) (1.2%) 8211 6997 6351 0546 0585 0542 0751 0811
(1.1%) (1.2%) 6841 (3.5%) 5225 6612 (1.1%) 2923 (0.86%) 2450 6353 2925
2471
8997 6544 4236 0574 9410 0118 (2.7%) 0142 2472 6911 0579 0561 2882 5225 2820
0980 0620
2483
8481 (0.81%) 3354 3232 (1.2%) (0.81%) 6658 0913 5121 1124 6651
(1.1%) 8471 0011 0451 6652 3232
EXPORT
2008 TREEMAP TOTAL EXPORTS: 109.10 b / 15.56 T (0.7%)
Total Exports: 109.10 B / 15.56 T (0.7%)
7132 (8.2%) Internal combustion 7810 (8.1%) Cars 7643 (12%) Television & radio transmitters 7731 (2.9%) Electric wire 6842 (1%) 7752 (0.71%)
engines for motor vehicles
6911
6428
3510 (1.2%) 8211 (1.1%)
Electric Chairs & 6353
current seats
5417 (3.6%) Medicaments 5831 5834
7611 (5.1%) Color T.V. 7649 (2.2%) (0.51%)
Parts of telecom &
7849 (4.4%) Other vehicles 7139 (1.1%) 7212 7868 sound recording
parts equipment
5148
7431 7783 8939 (1.1%) 0819
7239 7162
Miscellaneous
7525 (2.2%) Control & 7528 7518 7763 articles of plastic
peripheral hardware
6251 7169 7434 7784 0440 (1.2%) 2224 0980
Unmilled maize (0.68%)
7721 (2.7%) Switchboards, 7422 7758 7523 (1.7%) CPUs 7638 7757 8124 2226
relays & fuses 8931
8749 7429 6289 0412 (0.7%)
7415 2820
6991 7919 6418
(0.58%)
7499 7722 0114
8743 (1.4%) 8732 7732 7782 (0.83%) 7149 6727 (0.58%)
(0.5%) (0.5%) 0113
* Numbers indicate SITC-4 rev 2 codes. Parenthesis indicate percentage of total exports. Treemap Headers show: Total Trade/Total World Trade (share of world trade represented by the country).