Page 190 - The Atlas of Economic Complexity
P. 190

MAPPING PATHS TO PROSPERITY  |  191


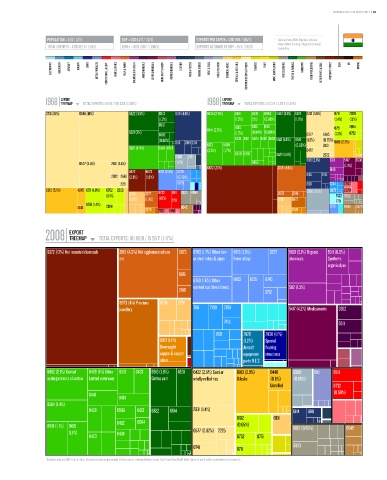
                   POPULATION ≥ 1.1 b / (2/1)  GDP ≥ USD 1.2 T / (12/1)   EXPORTS PER CAPITA ≥ USD 160 / (116/2)  *   Data are from 2008. Numbers indicate:
                                                                                                          value (World Ranking / Regional Ranking).
                   TOTAL EXPORTS ≥ USD 182 b / (24/1)  GDPpc ≥ USD 1,067 / (108/2)  EXPORTS AS SHARE OF GDP ≥ 15 % (116/3)    South Asia.

                    ELECTRONICS  MACHINERY  AIRCRAFT   bOILERS   SHIPS   METAL PRODUCTS  CONSTR. MATL. & EqPT.  HOME & OFFICE  PULP & PAPER  CHEMICALS & HEALTH  AGROCHEMICALS  OTHER CHEMICALS  INOR. SALTS & ACIDS  PETROCHEMICALS  LEATHER  MILK & CHEESE  ANIMAL FIbERS  MEAT & EGGS  FISH & SEAFOOD  TROPICAL AGRIC.  CEREALS & vEG. OILS  COTTON/RICE/SOY & OTHERS  TObACCO  FRUIT  MISC. AGRICULTURE  NOT CLASSIFIED  TEXTILE & FAbRICS  GARMENTS  FOOD PROCESSING  bEER/SPIRITS & CIGS.  PRECIOUS STONES  COAL  OIL  MINING


                        EXPORT                                                      EXPORT
                  1968 TREEMAP  TOTAL EXPORTS: 1.97 b / 228.33 b (0,86%)      1988 TREEMAP  TOTAL EXPORTS: 16.03 b / 2.79 T (0.57%)
                                         Total Exports: 1.97 B / 228.33 B (0.86%)                    Total Exports: 16.03 B / 2.79 T (0.57%)
                  0741 (16%)   6545 (16%)        6522 (3.5%)  6513  6118 (4.8%)  8435 (2.9%)  8481  8433  6584  6592 (3.1%) 6521  0741 (3.6%)  0711  2929
                                                            (1.2%)                       (1.5%)  (1%)  (0.98%)  (1.9%)       (1.4%)  (1.1%)
                                                            6519                         8510  8310  8451                          2924
                                                                              8441 (2.6%)                                    0751
                                                 6521 (3%)                               (1.2%)  (0.94%) (0.89%)             (1.3%)  0752
                                                            6592                                                   0577  6545
                                                            (0.92%)                      8434 8471 6594 8462 6581 6513 (1.8%) 6541  (1.6%)  (0.79%) 0813 (2.2%)
                                                                  6114  2919 2114  6123  8439                  (0.95%)
                                                 6581 (4.4%)  6584 8510                                                  0421
                                                                              (2.3%)  (1.7%)                       0422
                                                                  0360  2911             8459 6596      6522 (1.6%)  6116 (2.1%)  2922 5311  5417  5530
                               0577 (5.4%)  2631 (1.4%)           (1.2%)                       8463                              (1.3%)
                                                                              6672 (20%)                2815 (4.6%)
                                                 6672  6673  6712 (2.5%) 6733                                               5146
                                          2922 2640 (2.3%)  (1.8%)  (0.96%)                                        6114  6115
                                              2221                 6725                                            6113     7244  6953
                  0813 (5.1%)  4245 0711 (1.8%)  0752 2929  6732  6911 2820 8999                                   0360 (3.1%)  6975  6978
                                         (1.1%)  2785  2877                                             2873  2816            7522 7853
                                                 (1.3%)  (1.3%)  (1.5%)  7731                           2731  8973            7761
                                 0751 (1.4%)
                              5513       2924          2879  7852 8960  0545                                  2879          6716  0545  0579


                           EXPORT
                  2008 TREEMAP        TOTAL EXPORTS: 181.88 b / 15.56 T (1.17%)
                                                                 Total Exports: 181.88 B / 15.56 T (1.17%)
                   6672 (13%) Not mounted diamonds  2815 (4.6%) Not agglomerated iron  2873  6783 (1.7%) Other iron  6716 (1.5%)  6727  5169 (2.1%) Organic  5311 (0.9%)
                                              ore                        or steel tubes & pipes  Ferro-alloys  chemicals   Synthetic
                                                                                                                           organic dyes
                                                                    6861
                                                                         6749 (1.6%) Other  6822  6725  6746
                                                                         worked iron/steel sheets            5112 (1.3%)
                                                                    2816                            6712

                                              8973 (4%) Precious  6794  2731
                                              jewellery                  7161  7139  7851                    5417 (4.2%) Medicaments  3352

                                                                                    7416                                       5911

                                                                                 7831       7929    7938 (1.1%)
                                                             6821 (1.1%)                    (1.2%)  Special
                                                             Unwrought                      Aircraft  floating
                                                             copper & copper                equipment  structures
                                                             alloys                         parts N.E.S.

                   8462 (2.1%) Knitted  8459 (1%) Other  8310  8433  6513 (1.6%)  6531  0422 (2.5%) Semi or  0813 (2.3%)  0440  0360  0111  6911
                   undergarments of cotton  knitted outerwear  Cotton yarn  wholly milled rice  Oilcake  (0.8%)  (0.86%)
                                                                                                      Unmilled               6732
                                                                                                      maize                  (0.59%)
                                  8441
                                             8481
                   6584 (1.4%)
                                  8439       6596   6123  6522  6514     2631 (1.4%)                          6114  6116
                                                                                         0612          0611
                                             8432   6594
                   8510 (1.1%) 8435                                                      (0.65%)              6613 (0.69%)        0545
                           (1.1%)            8434                        0577 (0.62%) 2225
                                  8423                                                   0752    0751
                                                                         0741            0711                 5823

                  * Numbers indicate SITC-4 rev 2 codes. Parenthesis indicate percentage of total exports. Treemap Headers show: Total Trade/Total World Trade (share of world trade represented by the country).
   185   186   187   188   189   190   191   192   193   194   195