
Page 216 - The Atlas of Economic Complexity
P. 216
MAPPING PATHS TO PROSPERITY | 217
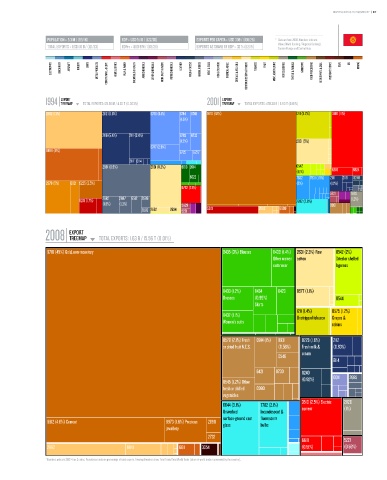
POPULATION ≥ 5.3 M / (95/16) GDP ≥ USD 5.1 b / (122/26) EXPORTS PER CAPITA ≥ USD 309 / (105/25) * Data are from 2008. Numbers indicate:
value (World Ranking / Regional Ranking).
TOTAL EXPORTS ≥ USD 1.6 b / (121/23) GDPpc ≥ USD 974 / (113/26) EXPORTS AS SHARE OF GDP ≥ 32 % (62/15) Eastern Europe and Central Asia.
ELECTRONICS MACHINERY AIRCRAFT bOILERS SHIPS METAL PRODUCTS CONSTR. MATL. & EqPT. HOME & OFFICE PULP & PAPER CHEMICALS & HEALTH AGROCHEMICALS OTHER CHEMICALS INOR. SALTS & ACIDS PETROCHEMICALS LEATHER MILK & CHEESE ANIMAL FIbERS MEAT & EGGS FISH & SEAFOOD TROPICAL AGRIC. CEREALS & vEG. OILS COTTON/RICE/SOY & OTHERS TObACCO FRUIT MISC. AGRICULTURE NOT CLASSIFIED TEXTILE & FAbRICS GARMENTS FOOD PROCESSING bEER/SPIRITS & CIGS. PRECIOUS STONES COAL OIL MINING
EXPORT EXPORT
1994 TREEMAP TOTAL EXPORTS: 121.56 M / 4.30 T (0.003%) 2001 TREEMAP TOTAL EXPORTS: 470.38 b / 5.90 T (0.01%)
Total Exports: 121.56 M / 4.30 T (0.003%) Total Exports: 470.38 M / 5.90 T (0.01%)
2882 (13%) 2112 (6.6%) 6746 (6.1%) 6744 6745 9710 (52%) 1211 (5.7%) 3510 (11%)
(1.5%)
2116 (5.4%) 2111 (3.4%) 6783 6733
(1.2%) 2631 (5%)
6747 (2.9%)
6899 (11%) 6725 6727
2117 6114
2681 (9.5%) 2631 (8.3%) 6513 2614 0542
(1.1%) 6618 6924
6522 7832 7831 (1.5%) 2111 2116 0240
2879 (5%) 6821 5225 (2.5%) (2%) (1.2%)
6732 (2.1%)
5221 2820
2682 2687 6512 2686 (1.2%)
5241 (1.7%) 7782 (2.8%)
(1.8%) (1.3%) 5629 8931
2683 2632 2634 5221 5241 2882 6899
EXPORT
2008 TREEMAP TOTAL EXPORTS: 1.63 b / 15.56 T (0.01%)
Total Exports: 1.63 B / 15.56 T (0.01%)
9710 (45%) Gold, non-monetary 8435 (3%) Blouses 8439 (1.4%) 2631 (2.3%) Raw 0542 (2%)
Other women cotton Dried or shelled
outerwear legumes
8433 (1.2%) 8434 8423 0577 (1.1%)
Dresses (0.99%) 0544
Skirts
1211 (1.4%) 0575 (1.2%)
8432 (1.1%) Unstripped tobacco Grapes &
Women's suits
raisins
0579 (2.1%) Fresh 0914 (1%) 8931 0223 (1.6%) 2112
or dried fruit N.E.S. (0.56%) Fresh milk & (0.63%)
cream
0546
6114
6421 0730 0240
(0.92%) 0011 2685
0545 (1.2%) Other
fresh or chilled 0980
vegetables
3510 (2.5%) Electric 2820
6644 (3.1%) 7782 (2.1%) current (1%)
Unworked Incandescent &
surface-ground cast fluorescent
6612 (4.6%) Cement 8973 (1.6%) Precious 2890 glass bulbs
jewellery
2732
6618 5221
2882 6841 6811 3354 (0.51%) (0.56%)
* Numbers indicate SITC-4 rev 2 codes. Parenthesis indicate percentage of total exports. Treemap Headers show: Total Trade/Total World Trade (share of world trade represented by the country).