Page 218 - The Atlas of Economic Complexity
P. 218

MAPPING PATHS TO PROSPERITY  |  219


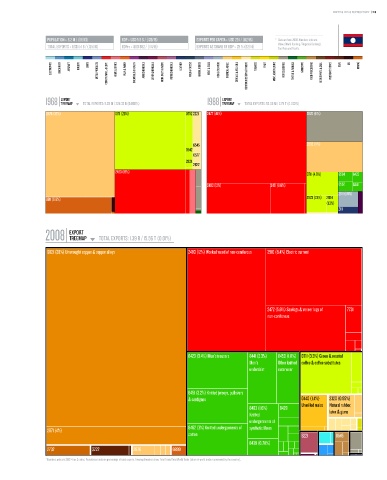
                   POPULATION ≥ 6.2 M / (88/13)  GDP ≥ USD 5.5 b / (120/15)  EXPORTS PER CAPITA ≥ USD 224 / (112/16)  *   Data are from 2008. Numbers indicate:
                                                                                                          value (World Ranking / Regional Ranking).
                   TOTAL EXPORTS ≥ USD 1.4 b / (125/16)  GDPpc ≥ USD 882 / (114/15)  EXPORTS AS SHARE OF GDP ≥ 25 % (82/14)    East Asia and Pacific.

                    ELECTRONICS  MACHINERY  AIRCRAFT   bOILERS   SHIPS   METAL PRODUCTS  CONSTR. MATL. & EqPT.  HOME & OFFICE  PULP & PAPER  CHEMICALS & HEALTH  AGROCHEMICALS  OTHER CHEMICALS  INOR. SALTS & ACIDS  PETROCHEMICALS  LEATHER  MILK & CHEESE  ANIMAL FIbERS  MEAT & EGGS  FISH & SEAFOOD  TROPICAL AGRIC.  CEREALS & vEG. OILS  COTTON/RICE/SOY & OTHERS  TObACCO  FRUIT  MISC. AGRICULTURE  NOT CLASSIFIED  TEXTILE & FAbRICS  GARMENTS  FOOD PROCESSING  bEER/SPIRITS & CIGS.  PRECIOUS STONES  COAL  OIL  MINING


                        EXPORT                                                      EXPORT
                  1968 TREEMAP  TOTAL EXPORTS: 5.28 M / 228.33 b (0.002%)     1988 TREEMAP  TOTAL EXPORTS: 53.05 M / 2.79 T (0.002%)
                                        Total Exports: 5.28 M / 228.33 B (0.002%)                    Total Exports: 53.05 M / 2.79 T (0.002%)
                  2876 (37%)                0711 (26%)                0752 2221  2472 (45%)                        2820 (11%)


                                                                         6545                                      2882 (11%)
                                                                      0542
                                                                         0577
                                                                      2924
                                                                         2922
                                            2483 (19%)
                                                                                                                   0711 (4.6%)  6584  8423
                                                                              2483 (12%)              2471 (6.6%)              6552  8441
                                                                                                                               2911 (1.9%)
                  6811 (6.8%)                                                                                      2923 (2.1%) 2924
                                                                                                                          (1.3%)
                                                                                                                               2111


                           EXPORT
                  2008 TREEMAP        TOTAL EXPORTS: 1.39 b / 15.56 T (0.01%)
                                                                 Total Exports: 1.39 B / 15.56 T (0.01%)
                   6821 (38%) Unwrought copper & copper alloys         2483 (12%) Worked wood of non-coniferous  3510 (8.4%) Electric current


                                                                                                     2472 (5.6%) Sawlogs & veneer logs of  7731
                                                                                                     non-coniferous


                                                                       8423 (3.4%) Men's trousers  8441 (2.3%)  8459 (1.8%) 0711 (3.3%) Green & roasted
                                                                                              Men's      Other knitted coffee & coffee substitutes
                                                                                              undershirt  outerwear


                                                                       8451 (3.2%) Knitted jerseys, pullovers
                                                                       & cardigans                               0440 (1.4%)  2320 (0.95%)
                                                                                                                 Unmilled maize  Natural rubber,
                                                                                              8463 (1.6%)  8429
                                                                                              Knitted                       latex & gums
                                                                                              undergarments of
                                                                       8462 (3%) Knitted undergarments of  synthetic fibers
                   2871 (4%)
                                                                       cotton                                    5221         0545
                                                                                              8439 (0.78%)
                   2732            3222            2876          6899
                  * Numbers indicate SITC-4 rev 2 codes. Parenthesis indicate percentage of total exports. Treemap Headers show: Total Trade/Total World Trade (share of world trade represented by the country).
   213   214   215   216   217   218   219   220   221   222   223