
Page 220 - The Atlas of Economic Complexity
P. 220
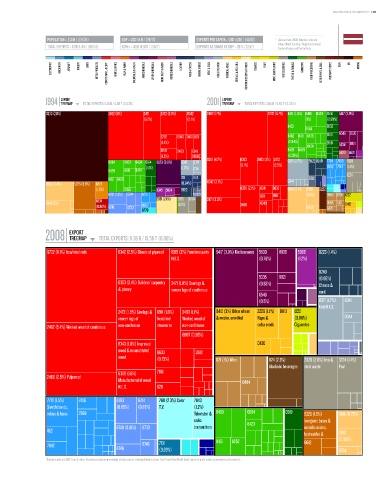
MAPPING PATHS TO PROSPERITY  |  221


                   POPULATION ≥ 2.3 M / (119/24)  GDP ≥ USD 34 b / (79/17)  EXPORTS PER CAPITA ≥ USD 4,130 / (43/10)  *   Data are from 2008. Numbers indicate:
                                                                                                          value (World Ranking / Regional Ranking).
                   TOTAL EXPORTS ≥ USD 9.4 b / (80/18)  GDPpc ≥ USD 14,937 / (38/7)  EXPORTS AS SHARE OF GDP ≥ 28 % (72/17)    Eastern Europe and Central Asia.

                    ELECTRONICS  MACHINERY  AIRCRAFT   bOILERS   SHIPS   METAL PRODUCTS  CONSTR. MATL. & EqPT.  HOME & OFFICE  PULP & PAPER  CHEMICALS & HEALTH  AGROCHEMICALS  OTHER CHEMICALS  INOR. SALTS & ACIDS  PETROCHEMICALS  LEATHER  MILK & CHEESE  ANIMAL FIbERS  MEAT & EGGS  FISH & SEAFOOD  TROPICAL AGRIC.  CEREALS & vEG. OILS  COTTON/RICE/SOY & OTHERS  TObACCO  FRUIT  MISC. AGRICULTURE  NOT CLASSIFIED  TEXTILE & FAbRICS  GARMENTS  FOOD PROCESSING  bEER/SPIRITS & CIGS.  PRECIOUS STONES  COAL  OIL  MINING


                        EXPORT                                                      EXPORT
                  1994 TREEMAP  TOTAL EXPORTS: 1.46 b / 4.30 T (0.03%)        2001 TREEMAP  TOTAL EXPORTS: 2.04 b / 5.90 T (0.03%)
                                         Total Exports: 1.46 B / 4.30 T (0.03%)                      Total Exports: 2.04 B / 5.90 T (0.03%)
                  3330 (28%)             2482 (11%)    2471  2472 (3.9%)  6342  2482 (17%)           6732 (5.7%) 8451 (1.4%) 8465 8439 6514  5417 (2.9%)
                                                       (5.2%)          (2.1%)                                      (1%)    (0.99%)
                                                                                                            8423           6553
                                                                                                                   6584
                                                             6732  6343 2460 8211                           8462 8431 8435  6513  6546 5530
                                                             (1.4%)                                         (0.94%)        6519    8921
                                                                                                                   8434        5334
                                                             8219  2483  6341                               8429 8459          5629 5621
                                                             (1.2%)      6359                               (0.75%)
                                         6584  8423  8434 6514  5623 (3.9%)  0342  0371  8219 (4.7%)  6353  2483 (3%) 2472  0371 (2.7%)  5922 0240 7784 7499 8928
                                                                                                       (2.5%)
                                                                                          (3.1%)
                                                       (1.1%)       (1.2%) 0341                                            6992 7913 (1.4%)
                                         8439  8431  8424
                                                                                                                                  3224
                                         8451 8429                  2111  6114                                      6512
                  2882 (3.4%)  5225 (3.8%)  6821                    (0.94%)   6342 (3.7%)                   0344
                                     (1.3%)    8465        3345 5824  5922                6359 (2.1%) 6341  6633  6841 (3.1%) 2882  3222
                                         6712 (1.5%) 6744  6731                                   8211  6911       (1.5%)  0980 8931 1222
                                     6831                  2631 (2.1%)  2820  3224  2471 (3.3%)
                  6841 (2%)                                        (1.2%)                 2460    6343                     0585 1110  0412
                                     (0.88%) 6716  6733  6992                                                      8974    6421
                                                      6770

                           EXPORT
                  2008 TREEMAP        TOTAL EXPORTS: 9.36 b / 15.56 T (0.06%)
                                                                 Total Exports: 9.36 B / 15.56 T (0.06%)
                   6732 (8.1%) Iron/steel rods  6342 (2.5%) Sheets of plywood  8219 (2%) Furniture parts  5417 (3.9%) Medicaments 5530  8939  5989  0223 (1.4%)
                                                                 N.E.S.                          (0.76%)        (1.2%)
                                                                                                                        0240
                                                                                                 5335    8921           (0.95%)
                                             6353 (2.4%) Builders` carpentry  2471 (1.9%) Sawlogs &  (0.53%)            Cheese &
                                             & joinery           veneer logs of coniferous                              curd
                                                                                                 6546
                                                                                                 (0.5%)                 0371 (1.7%)  0341
                                                                                                                        Fish N.E.S.
                                             2472 (1.9%) Sawlogs & 6911 (1.6%)  2483 (1.1%)  0412 (3%) Other wheat  2226 (1.1%) 0813  1222
                                             veneer logs of  Iron/steel  Worked wood of  & meslin, unmilled  Rape &  (0.98%)     0344
                   2482 (5.4%) Worked wood of coniferous  non-coniferous  structures  non-coniferous  colza seeds  Cigarretes
                                                                     6997 (0.86%)
                                             6343 (1.8%) Improved                                0430
                                             wood & reconstituted  6633   3510
                                             wood           (0.73%)              1121 (1%) Wine      1124 (2.3%)  2820 (2.8%) Iron & 3224 (1.4%)
                                                                                                     Alcoholic beverages  steel waste  Peat
                                             6359 (1.6%)    7861
                   2460 (2.5%) Pulpwood
                                             Manufactured of wood                          0484
                                             N.E.S.         8211

                   7721 (1.5%)  7436        6783    6744    7611 (2.3%) Color  7643
                   Switchboards,            (0.89%)  (0.87%)  T.V.       (1.2%)
                   relays & fuses  7868                                  Television &  8465  6584          6519   5225 (1.5%)  6841 (0.72%)
                                                                         radio                                    Inorganic bases &
                                            6749 (0.81%)  6733           transmitters        8423                 metallic oxides,
                   8121
                                                                                                                  hydroxides &  2882
                                                                                                                               (0.69%)
                                                                                                                  6612
                   7842                               6745  7131                 8451  6552                       peroxides
                                            6746            (0.59%)                                                            6794
                  * Numbers indicate SITC-4 rev 2 codes. Parenthesis indicate percentage of total exports. Treemap Headers show: Total Trade/Total World Trade (share of world trade represented by the country).