
Page 222 - The Atlas of Economic Complexity
P. 222
MAPPING PATHS TO PROSPERITY | 223
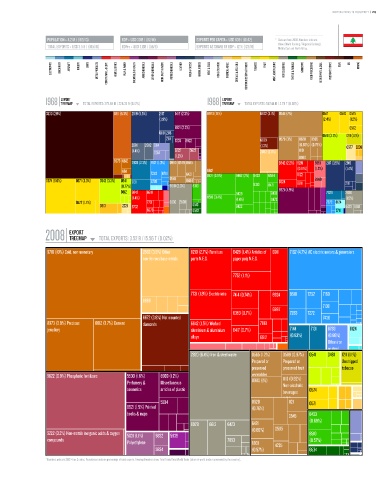
POPULATION ≥ 4.2 M / (105/13) GDP ≥ USD 30 b / (82/14) EXPORTS PER CAPITA ≥ USD 839 / (81/12) * Data are from 2008. Numbers indicate:
value (World Ranking / Regional Ranking).
TOTAL EXPORTS ≥ USD 3.5 b / (105/16) GDPpc ≥ USD 7,138 / (55/8) EXPORTS AS SHARE OF GDP ≥ 12 % (123/16) Middle East and North Africa.
ELECTRONICS MACHINERY AIRCRAFT bOILERS SHIPS METAL PRODUCTS CONSTR. MATL. & EqPT. HOME & OFFICE PULP & PAPER CHEMICALS & HEALTH AGROCHEMICALS OTHER CHEMICALS INOR. SALTS & ACIDS PETROCHEMICALS LEATHER MILK & CHEESE ANIMAL FIbERS MEAT & EGGS FISH & SEAFOOD TROPICAL AGRIC. CEREALS & vEG. OILS COTTON/RICE/SOY & OTHERS TObACCO FRUIT MISC. AGRICULTURE NOT CLASSIFIED TEXTILE & FAbRICS GARMENTS FOOD PROCESSING bEER/SPIRITS & CIGS. PRECIOUS STONES COAL OIL MINING
EXPORT EXPORT
1968 TREEMAP TOTAL EXPORTS: 275.58 M / 228.33 b (0.12%) 1988 TREEMAP TOTAL EXPORTS: 587.44 M / 2.79 T (0.02%)
Total Exports: 275.58 M / 228.33 B (0.12%) Total Exports: 587.44 M / 2.79 T (0.02%)
3330 (29%) 6811 (5.3%) 2919 (5.5%) 2117 5417 (2.3%) 8973 (19%) 6672 (3.1%) 0545 (7%) 0571 0574 0575
(1.9%) (2.4%) (1.2%)
8921 (2.2%) 0572
6118 2116 0541 (3.7%) 1211 (1.1%)
2114 5335 8922 6673 0579 (3%) 0620 0565
2681 2682 0114 (1.3%) (0.85%) (0.79%) 0577 2238
(1.4%) 5222 5622 2882 (2.6%) 1110
0014
(1.2%) 0980
8973 6612 7928 (2.3%) 7821 (1.3%) 0980 0579 0585 6842 (2.2%) 8219 8851 2117 (3.5%) 2919
(0.81%) (1.2%) (1.4%)
6611 6612
7283 6781 6421 8421 (3.9%) 8462 (2%) 8433 6584 8122
0545 8960
0574 (6.6%) 0571 (3.3%) 0542 (3.3%) 0541 7131 6785 0484 6624 6911 2111
(0.77%) 9610 (2.3%) 8310 8310 8471
0812 6842 6618 8439 8431 8921 (4.9%) 7929 2820
(1.4%) 8510 (3.4%) (1.4%) 8472 (1.5%)
0572 (1.7%) 7731 8830 2820 7272 8124
0813 2221 6732 6513 8423 6423 6651
6973 6592 7711
EXPORT
2008 TREEMAP TOTAL EXPORTS: 3.52 b / 15.56 T (0.02%)
Total Exports: 3.52 B / 15.56 T (0.02%)
9710 (10%) Gold, non-monetary 2882 (3.5%) Other 8219 (2.7%) Furniture 6428 (1.4%) Articles of 6911 7162 (4.7%) AC electric motors & generators
non-ferrous base metals parts N.E.S. paper pulp N.E.S.
7752 (1.1%)
7731 (1.9%) Electric wire 7414 (0.74%) 6924 9510 7252 7169
6998
7138
6997
6353 (0.7%) 7283 7272
6672 (3.8%) Not mounted 7436
8973 (3.9%) Precious 6612 (3.7%) Cement diamonds 6842 (1.5%) Worked 7861
jewellery aluminium & aluminium 6417 (0.7%) 7144 7131 6783 8124
alloys 6912 (0.83%) (0.86%)
Other iron
or steel
2820 (6.4%) Iron & steel waste 0565 (1.2%) 0589 (0.97%) 0541 0481
tubes & 1211 (1.1%)
Prepared or Prepared or pipes Unstripped
preserved preserved fruit tobacco
5622 (6.9%) Phosphatic fertilizers 5530 (1.6%) 8939 (1.2%) vegetables 1110 (0.92%)
Perfumery & Miscellaneous 0980 (1%) Non-alcoholic
cosmetics articles of plastic 0574
beverages
N.E.S.
5334 0620 1121 0571
8921 (1.5%) Printed (0.76%)
books & maps 0545 8433
8928 6613 6423 6421 (0.69%)
(0.69%) 0585
5222 (3.2%) Non-metals inorganic acids & oxygen 5831 (1.1%) 5832 5839 8510
compounds 7853 (0.57%)
Polyethylene 8931 4235
5834 (0.57%) 6534
* Numbers indicate SITC-4 rev 2 codes. Parenthesis indicate percentage of total exports. Treemap Headers show: Total Trade/Total World Trade (share of world trade represented by the country).