
Page 256 - The Atlas of Economic Complexity
P. 256
MAPPING PATHS TO PROSPERITY | 257
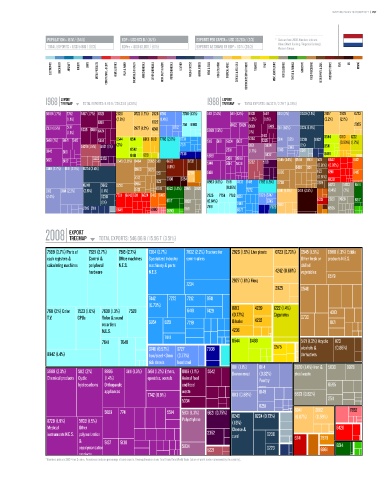
POPULATION ≥ 16 M / (54/6) GDP ≥ USD 873 b / (16/6) EXPORTS PER CAPITA ≥ USD 33,200 / (7/3) * Data are from 2008. Numbers indicate:
value (World Ranking / Regional Ranking).
TOTAL EXPORTS ≥ USD 546 b / (6/3) GDPpc ≥ USD 53,076 / (8/5) EXPORTS AS SHARE OF GDP ≥ 63 % (20/2) Western Europe.
ELECTRONICS MACHINERY AIRCRAFT bOILERS SHIPS METAL PRODUCTS CONSTR. MATL. & EqPT. HOME & OFFICE PULP & PAPER CHEMICALS & HEALTH AGROCHEMICALS OTHER CHEMICALS INOR. SALTS & ACIDS PETROCHEMICALS LEATHER MILK & CHEESE ANIMAL FIbERS MEAT & EGGS FISH & SEAFOOD TROPICAL AGRIC. CEREALS & vEG. OILS COTTON/RICE/SOY & OTHERS TObACCO FRUIT MISC. AGRICULTURE NOT CLASSIFIED TEXTILE & FAbRICS GARMENTS FOOD PROCESSING bEER/SPIRITS & CIGS. PRECIOUS STONES COAL OIL MINING
EXPORT EXPORT
1968 TREEMAP TOTAL EXPORTS: 9.95 b / 228.33 b (4.36%) 1988 TREEMAP TOTAL EXPORTS: 114.32 b / 2.79 T (4.09%)
Total Exports: 9.95 B / 228.33 B (4.36%) Total Exports: 114.32 B / 2.79 T (4.09%)
5989 (1.7%) 7742 5417 (1.7%) 8921 2926 0723 (1.7%) 2925 6746 7788 (1.3%) 5112 (2.4%) 5111 (1.3%) 8939 5417 0113 (2%) 0240 (2.1%) 2927 2926 0723
(1.1%) (2.8%) (1.4%) (1.2%) (1.1%) (2.2%) (2.1%)
6419 0722 7511 8983 8822 5829 2925
2331 (1.5%) 5137 5335 0819 2927 (1.2%) 4243 6712 5989 (1.5%) 0819 6419 0111 (1.6%) 0224 (1.8%)
(1.1%) 6424 (1%) 5413
5148 (1%) 6871 5415 5414 0544 0541 0813 5513 7782 (2.8%) 6731 5113 5161 5824 5137 5334 5335 0114 0251 0230 5922 0544 0813 1222
(0.99%) (1.2%)
5629 (1.5%) 5621 (1%) (2%) 7271 5831 5834 0149 (1%) 0541
3345 5161 0542 1223 7938 2331 (1.7%) 5832 0013 0341 0488
0481
5155 5162 5222 3352 0545 (2.8%) 0484 0565 5121 6672 3232 5839 5138 8996 5232 5621 0545 (1.4%) 0565 8931 5121 6842 6412
5148
5514 5836
0149 (2.7%) 0111 (2.5%) 0224 (3.4%) 0980 0620 (1.9%) 0484 0121 (0.81%) (0.97%)
1221 2783 5156 0980 1123 6911 6415
4313 3330 3354 (0.81%) 6428
0240 5922 0730 0914 1123 8983 (1.6%) 7518 7832 6418 7782 (1.5%) 0730 0619 5823 5833 6514
(0.95%)
0113 0114 (2.3%) (2.6%) (1.1%) 6421 0619 6522 (1.4%) 2665 2820 7272 6841 (1.8%) 3414 (2.8%) (1.4%) (1%)
(2.4%) 0230 7731 6842 6911 6624 6412 6415 7525 7754 7763 6251 6725 6747 2820 8928
(1%) 6517 8928 (0.84%) 7449 6745 2882 5241 6517
2919 2111 6649 6960 2690 6591 7591 6572 7923 6595
EXPORT
2008 TREEMAP TOTAL EXPORTS: 546.06 b / 15.56 T (3.51%)
Total Exports: 546.06 B / 15.56 T (3.51%)
7599 (3.7%) Parts of 7525 (2.7%) 7518 (2.7%) 7284 (2.7%) 7832 (2.2%) Tractors for 2926 (1.9%) Live plants 0723 (0.73%) 0545 (1.5%) 0980 (1.3%) Edible
cash registers & Control & Office machines Specialized industry semi-trailers Other fresh or products N.E.S.
calculating machines peripheral N.E.S. machinery & parts chilled
hardware N.E.S 4242 (0.68%) vegetables
0579
2927 (1.8%) Flora
7234
2925 0546
7442 7272 7212 8741
(0.73%) 0813 4239 1222 (1.4%)
7611 (2%) Color 7523 (1.6%) 7638 (1.3%) 7528 6418 7429 4313
T.V. CPUs Video & sound (0.77%) 4232 Cigarretes 0730
Oilcake
recorders 6954 6251 7219 0121
N.E.S. 4236
7441
7641 7648 0544 0488 5121 (1.3%) Acyclic 1123
6746 (0.97%) 6727 7938 0575 alcohols & (0.85%)
8942 (1.4%) Iron/steel <3mm (0.77%) derivatives
tick sheets Iron/steel
5989 (2.3%) 5112 (2%) 8996 5111 (1.3%) 5161 (1.2%) Ethers, coils 0819 (1.1%) 5542 0111 (1.1%) 0114 2820 (1.4%) Iron & 5833 8928
(0.82%)
steel waste
Bovine meat
Chemical products Cyclic (1.4%) epoxides, acetals Animal feed Poultry
hydrocarbons Orthopaedic and food meat 6595
appliances waste 0149
7742 (0.9%) 0113 (0.88%) 5823 (0.82%)
5334 2511
0251
5829 7741 5514 5831 (1.3%) 5621 (0.75%) 0240 0224 (0.73%) 6841 2882 7852
8720 (1.9%) 5839 (1.5%) Polyethylene (1.5%) (0.87%) (0.59%)
Medical Other Cheese & 6428
instruments N.E.S. polymerization 3352 curd 0230
& 5137 5138 5241 2879
copolymarization 5834 5221 0223 6861 6514
products
* Numbers indicate SITC-4 rev 2 codes. Parenthesis indicate percentage of total exports. Treemap Headers show: Total Trade/Total World Trade (share of world trade represented by the country).