Page 258 - The Atlas of Economic Complexity
P. 258

MAPPING PATHS TO PROSPERITY  |  259


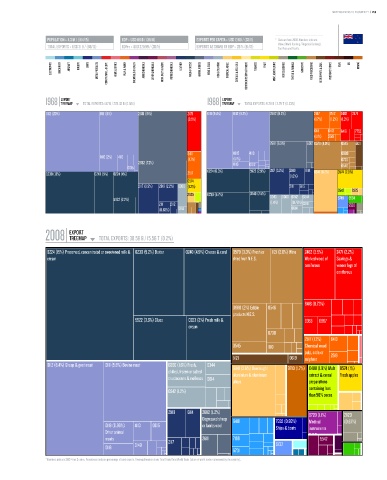
                   POPULATION ≥ 4.3 M / (104/15)  GDP ≥ USD 118 b / (55/11)  EXPORTS PER CAPITA ≥ USD 7,168 / (33/6)  *   Data are from 2008. Numbers indicate:
                                                                                                          value (World Ranking / Regional Ranking).
                   TOTAL EXPORTS ≥ USD 31 b / (60/12)  GDPpc ≥ USD 27,599 / (26/5)  EXPORTS AS SHARE OF GDP ≥ 26 % (81/13)    East Asia and Pacific.

                    ELECTRONICS  MACHINERY  AIRCRAFT   bOILERS   SHIPS   METAL PRODUCTS  CONSTR. MATL. & EqPT.  HOME & OFFICE  PULP & PAPER  CHEMICALS & HEALTH  AGROCHEMICALS  OTHER CHEMICALS  INOR. SALTS & ACIDS  PETROCHEMICALS  LEATHER  MILK & CHEESE  ANIMAL FIbERS  MEAT & EGGS  FISH & SEAFOOD  TROPICAL AGRIC.  CEREALS & vEG. OILS  COTTON/RICE/SOY & OTHERS  TObACCO  FRUIT  MISC. AGRICULTURE  NOT CLASSIFIED  TEXTILE & FAbRICS  GARMENTS  FOOD PROCESSING  bEER/SPIRITS & CIGS.  PRECIOUS STONES  COAL  OIL  MINING


                        EXPORT                                                      EXPORT
                  1968 TREEMAP  TOTAL EXPORTS: 1.17 b / 228.33 b (0.51%)      1988 TREEMAP  TOTAL EXPORTS: 9.28 b / 2.79 T (0.33%)
                                         Total Exports: 1.17 B / 228.33 B (0.51%)                    Total Exports: 9.28 B / 2.79 T (0.33%)
                  0112 (20%)          0111 (11%)     2681 (15%)        2471   0111 (9.4%)  0112 (9.2%)  2682 (8.2%)   2517  2512  2482  2471
                                                                       (3.5%)                                         (1.7%)  (1.2%) (1.3%)

                                                                                                                      6411  6413  6416  7752
                                                                                                                      (1.1%)  2519
                                                                                                      2681 (6.3%)  6512 0579 (4.9%)  0545  5121
                                                                       6411             0015  4113                              0980
                                      0116 (2%)  4113                  (1.7%)           (1.1%)                                  0730
                                                     2682 (7.2%)                        0116  0012
                                                0015                                          5922 (2.9%) 2117 (3.2%)  2919  6114  0546
                  0230 (13%)        0240 (5%)  0224 (4%)               2517   0224 (6.3%)                             6841 (6.2%)  0574 (2.9%)
                                                                                                             (1.6%)
                                                                       0574
                                                     2117 (3.9%)  2919 (2.2%) 0360 (1.2%)                    2111  6115
                                                                                                                               0542  2925
                                                                       2925   0230 (5.7%)     0240 (2.5%)  0343  0360 0342  0344
                                           5922 (2.2%)                                                                         6749 6594
                                                            2111  2112                                (1.4%)  (0.79%) 0341         5530
                                                            (0.83%)  0814                                     0814


                           EXPORT
                  2008 TREEMAP        TOTAL EXPORTS: 30.59 b / 15.56 T (0.2%)
                                                                 Total Exports: 30.59 B / 15.56 T (0.2%)
                   0224 (15%) Preserved, concentrated or sweetened milk & 0230 (5.2%) Butter  0240 (4.9%) Cheese & curd  0579 (3.3%) Fresh or  1121 (2.8%) Wine  2482 (2.5%)  2471 (2.2%)
                   cream                                                                dried fruit N.E.S.        Worked wood of  Sawlogs &
                                                                                                                  coniferous  veneer logs of
                                                                                                                              coniferous


                                                                                                                  6416 (0.73%)
                                                                                        0980 (2%) Edible  0546
                                                                                        products N.E.S.
                                                   5922 (3.6%) Glues   0223 (3%) Fresh milk &                     6353  6997
                                                                       cream
                                                                                                     0730
                                                                                                                  2517 (1.2%)  6413
                                                                                        0545         1110         Chemical wood
                                                                                                                  pulp, soda or
                                                                                        5121                 0619  sulphate  2519
                   0112 (8.4%) Sheep & goat meat  0111 (5.8%) Bovine meat  0360 (1.6%) Fresh,  0344  6841 (3.6%) Unwrought  9710 (1.7%) 0488 (1.9%) Malt 0574 (1%)
                                                                chilled, frozen or salted  aluminium & aluminium    extract & cereal  Fresh apples
                                                                crustaceans & molluscs 0814
                                                                                        alloys                      preparations
                                                                                                                    containing less
                                                                0342 (1.2%)
                                                                                                                    than 50% cocoa

                                                                2919   6114  2682 (1.2%)                            8720 (1.1%)  2820
                                                                            Degreased sheep  6418       7932 (0.98%)  Medical    (0.67%)
                                        0118 (0.99%)  4113  0015            or lambs wool               Ships & boats  instruments
                                        Other animal                                                                N.E.S.
                                        meats                               2681        7188                            5542
                                                   0149         2117                                    6727
                                        0116
                                                                                        6731
                  * Numbers indicate SITC-4 rev 2 codes. Parenthesis indicate percentage of total exports. Treemap Headers show: Total Trade/Total World Trade (share of world trade represented by the country).
   253   254   255   256   257   258   259   260   261   262   263