Page 260 - The Atlas of Economic Complexity
P. 260

MAPPING PATHS TO PROSPERITY  |  261


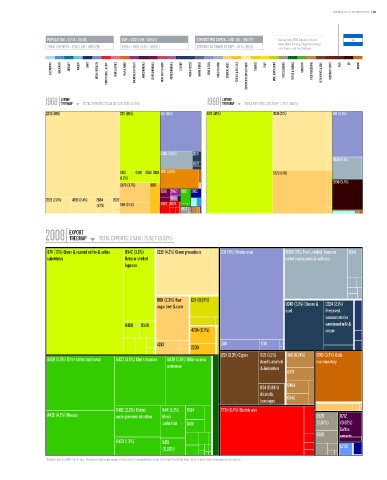
                   POPULATION ≥ 5.7 M / (91/16)  GDP ≥ USD 5.9 b / (119/21)  EXPORTS PER CAPITA ≥ USD 448 / (98/20)  *   Data are from 2008. Numbers indicate:
                                                                                                          value (World Ranking / Regional Ranking).
                   TOTAL EXPORTS ≥ USD 2.5 b / (109/20)  GDPpc ≥ USD 1,035 / (110/21)  EXPORTS AS SHARE OF GDP ≥ 43 % (39/3)    Latin America and the Caribbean.

                    ELECTRONICS  MACHINERY  AIRCRAFT   bOILERS   SHIPS   METAL PRODUCTS  CONSTR. MATL. & EqPT.  HOME & OFFICE  PULP & PAPER  CHEMICALS & HEALTH  AGROCHEMICALS  OTHER CHEMICALS  INOR. SALTS & ACIDS  PETROCHEMICALS  LEATHER  MILK & CHEESE  ANIMAL FIbERS  MEAT & EGGS  FISH & SEAFOOD  TROPICAL AGRIC.  CEREALS & vEG. OILS  COTTON/RICE/SOY & OTHERS  TObACCO  FRUIT  MISC. AGRICULTURE  NOT CLASSIFIED  TEXTILE & FAbRICS  GARMENTS  FOOD PROCESSING  bEER/SPIRITS & CIGS.  PRECIOUS STONES  COAL  OIL  MINING


                        EXPORT                                                      EXPORT
                  1968 TREEMAP  TOTAL EXPORTS: 173.44 M / 228.33 b (0.08%)    1988 TREEMAP  TOTAL EXPORTS: 238.78 M / 2.79 T (0.01%)
                                        Total Exports: 173.44 M / 228.33 B (0.08%)                   Total Exports: 238.78 M / 2.79 T (0.01%)
                  2631 (40%)                  0711 (15%)     0111 (10%)       0711 (42%)               2631 (21%)            0111 (8.6%)


                                                             0360 (3.6%)  2120
                                                                                                                             0360 (4.1%)
                                                                         5922
                                              0612  0481 0542 2924 2871 (4.8%)                         0573 (14%)
                                              (1.2%)
                                                                                                                             3330 (5.7%)
                                              0573 (3.7%)  0813
                                                             5530 5162 8510 5852
                  2223 (2.6%)  4233 (2.4%)  2634  2632           6210
                                     (1.7%)   0611 (2.1%)    2483 6924
                                                                    6932


                           EXPORT
                  2008 TREEMAP        TOTAL EXPORTS: 2.54 b / 15.56 T (0.02%)
                                                                 Total Exports: 2.54 B / 15.56 T (0.02%)
                   0711 (13%) Green & roasted coffee & coffee  0542 (3.6%)  2221 (4.2%) Green groundnuts  0111 (9%) Bovine meat  0360 (5%) Fresh, chilled, frozen or  0341
                   substitutes                  Dried or shelled                                           salted crustaceans & molluscs
                                                legumes


                                                           0611 (2.3%) Raw  1211 (0.97%)
                                                           sugar beet & cane                               0240 (3.1%) Cheese &  0224 (2.1%)
                                                                                                           curd           Preserved,
                                                                                                                          concentrated or
                                                0460  0548                                                                sweetened milk &
                                                                        4234 (0.7%)                                       cream

                                                           4242                    0011           0116
                                                                        2238
                                                                                   1221 (3.3%) Cigars  5121 (1.3%)  1110 (0.74%)  9710 (3.7%) Gold,
                   8459 (5.8%) Other knitted outerwear  8423 (3.9%) Men's trousers  8439 (3.6%) Other women  Acyclic alcohols  non-monetary
                                                               outerwear                          & derivatives
                                                                                                            6421

                                                                                                  1124 (0.89%)  0484
                                                                                                  Alcoholic  0545
                                                                                                  beverages

                                            8462 (2.2%) Knitted  8441 (1.2%)  8424  7731 (6.4%) Electric wire
                   8435 (4.7%) Blouses      undergarments of cotton  Men's                                             2820     0712
                                                             undershirt  8431                                          (0.67%)  (0.92%)
                                                                                                                                Coffee
                                                                                                                       8928     extracts,
                                            8429 (1.3%)      8451                                                               essences or
                                                             (0.66%)                                                            6733
                                                                                                                                concentrates
                  * Numbers indicate SITC-4 rev 2 codes. Parenthesis indicate percentage of total exports. Treemap Headers show: Total Trade/Total World Trade (share of world trade represented by the country).
   255   256   257   258   259   260   261   262   263   264   265